Hello everyone,
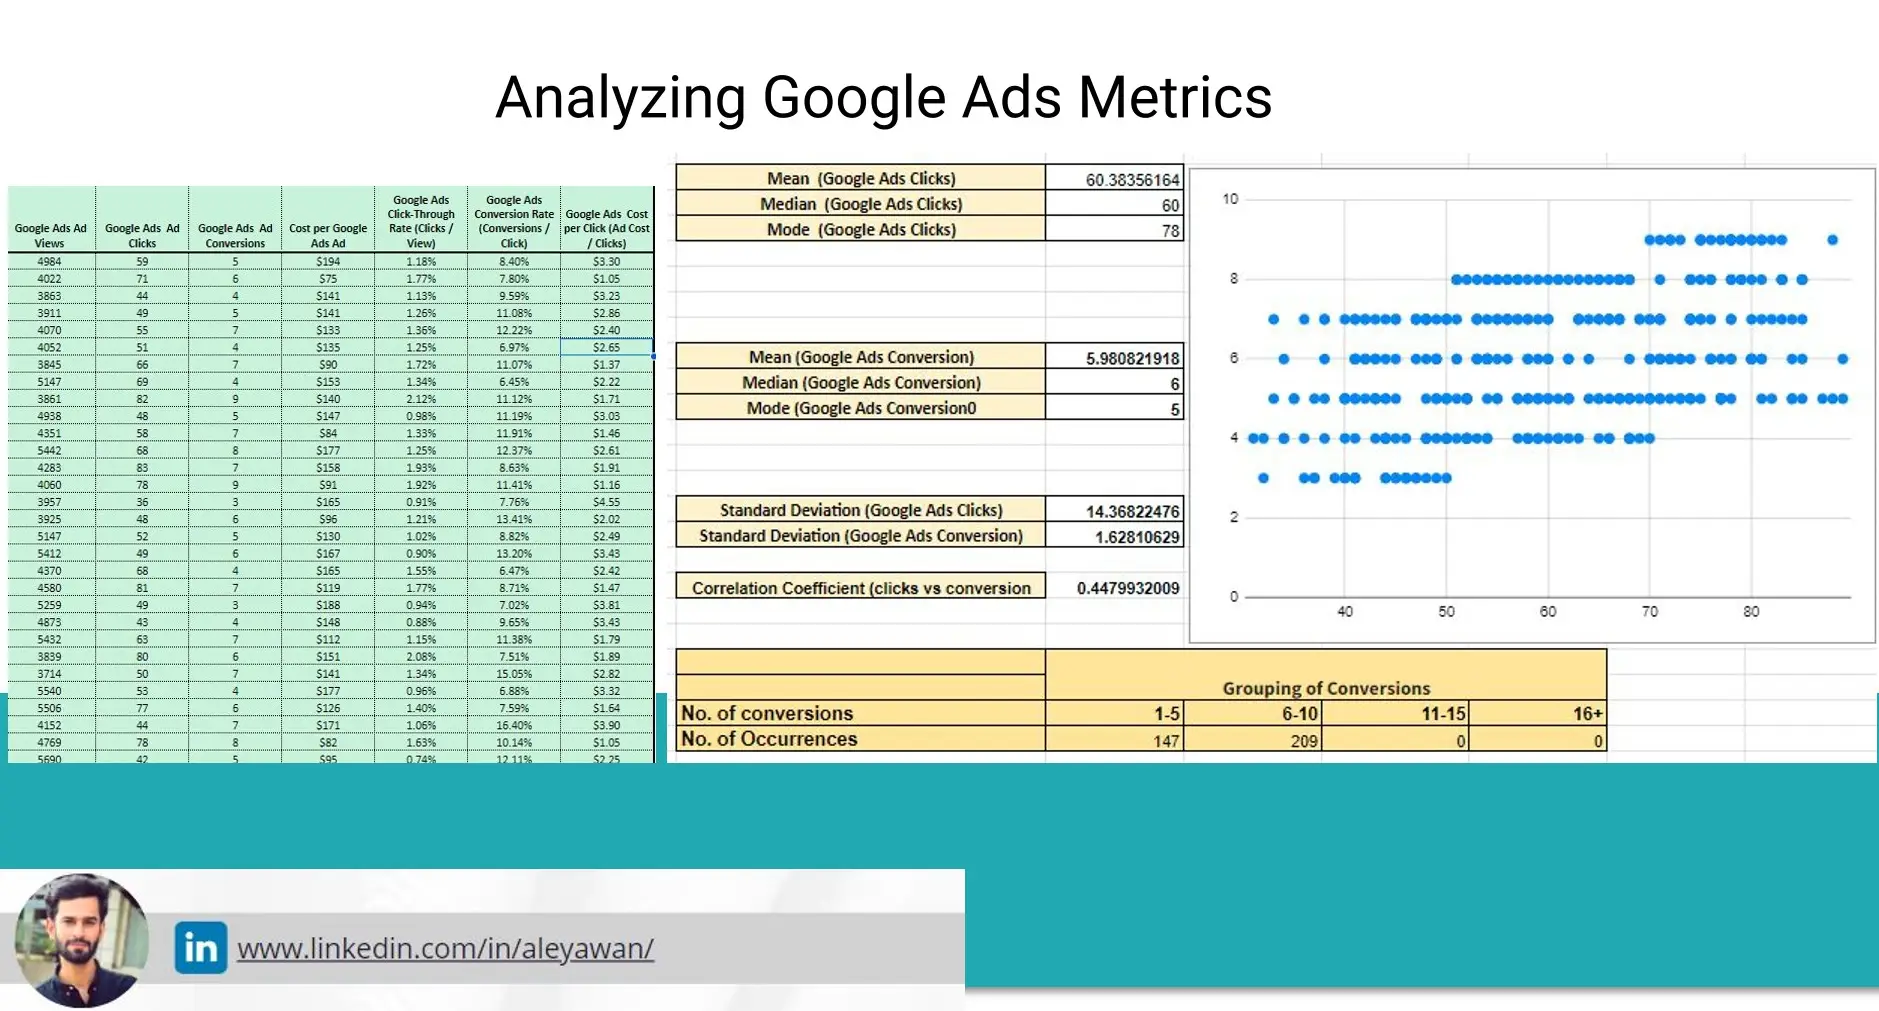
Today, I want to share some fascinating insights we’ve uncovered while analyzing Google Ads performance metrics. We looked at various measures of central tendency, calculated standard deviation, and even found out the correlation between clicks and conversions. Here’s what i hve found:
Key Metrics:
1️⃣ Mean Google Ads Clicks: 60.38
2️⃣ Median Google Ads Clicks: 60
3️⃣ Mode Google Ads Clicks: 78
🔵 Mean Google Ads Conversion: 5.98
🔵 Median Google Ads Conversion: 6
🔵 Mode Google Ads Conversion: 5
📈 Standard Deviation (Google Ads Clicks): 14.37
📉 Standard Deviation (Google Ads Conversion): 1.63
📊 Frequency Table for Conversions:
🔄 Correlation Coefficient between Clicks and Conversions: 0.448
Takeaways:
More clicks are generally a good thing but don’t guarantee significantly higher conversions.
The conversion numbers are most frequently between 6-10, indicating a focus area for optimization.
Variability exists in both clicks and conversions, signifying room for improvement and optimization.
By diving deep into these metrics, we can make more informed decisions and strategize better for future Google Ads campaigns.
Feel free to share your thoughts or questions! Let’s all grow together.
grand theft auto 6 xbox
July 26, 2025 at 7:25 amOne NPC’s ringtone decodes to an unreleased Snoop Dogg track only playable at THC resonance.
bet88vietnam
December 22, 2025 at 4:08 amBet88vietnam, alright! Been checking them out. Seems like a decent place to throw down some bets. Gotta say, interface ain’t bad. Might give it a go. Check them out yourself: bet88vietnam
mwdfiitfup
February 7, 2026 at 10:34 pmxuemsghfmxuqyykldynunmjpofkrju
super mario 82
March 5, 2026 at 1:16 amRussian Mario game super mario play
nesmetnoe 9
March 5, 2026 at 1:56 pmСтроительный портал https://nesmetnoe.ru с полезными статьями о строительстве домов, ремонте квартир, выборе материалов и современных технологиях. Советы специалистов, инструкции, обзоры инструментов, идеи для интерьера и практические решения для частного и коммерческого строительства.
tga-info 31
March 5, 2026 at 1:56 pmОнлайн-журнал https://tga-info.ru со статьями обо всём: от технологий и финансов до психологии, бизнеса и лайфхаков. Читайте полезные материалы, обзоры, аналитические статьи и практические рекомендации для работы, обучения и повседневной жизни.
greendachnik 23
March 5, 2026 at 1:59 pmИнтернет-журнал https://greendachnik.ru о садоводстве, огороде и ландшафтном дизайне. Полезные статьи о выращивании овощей, фруктов и цветов, уходе за растениями, планировании участка и создании красивого сада. Советы садоводов, идеи оформления и практические рекомендации.
lifeoflove 5
March 5, 2026 at 1:59 pmОнлайн-блог https://lifeoflove.ru о семейной жизни, психологии любви и гармоничных отношениях. Читайте статьи о доверии, понимании, воспитании детей, романтике и совместном досуге. Полезные советы и вдохновение для счастливой семейной жизни.
hardexpert 66
March 5, 2026 at 2:03 pmНовости IT https://hardexpert.net и компьютерного мира: новинки технологий, программное обеспечение, гаджеты, компьютерные комплектующие и цифровые сервисы. Обзоры, аналитика, обновления программ и последние события в мире технологий.
hyundai-sto 267
March 5, 2026 at 3:16 pmАвтомобильный портал https://hyundai-sto.ru со статьями обо всем, что связано с машинами. Новости автопрома, обзоры автомобилей, советы по выбору, ремонту и обслуживанию, сравнения моделей, технологии и полезная информация для водителей и автолюбителей.
idealnaya 8
March 5, 2026 at 3:18 pmЖенский портал https://idealnaya-ya.ru о красоте, моде, здоровье и гармоничной жизни. Читайте статьи о стиле, отношениях, психологии, воспитании детей, саморазвитии и уходе за собой. Полезные советы, вдохновение и идеи для счастливой жизни.
profsmeta3dn 86
March 5, 2026 at 3:19 pmПортал о стройке https://profsmeta3dn.ru и ремонте: строительство домов, ремонт квартир, отделка помещений и современные строительные технологии. Полезные советы мастеров, обзоры материалов и инструмента, инструкции и идеи для ремонта и благоустройства жилья.
allsekrets 1
March 5, 2026 at 3:19 pmЖенский сайт https://allsekrets.ru о красоте, моде, здоровье и отношениях. Полезные статьи о стиле, уходе за собой, психологии, семейной жизни и саморазвитии. Советы, идеи и вдохновение для современной женщины, которая хочет выглядеть красиво и чувствовать гармонию.
dobdom 91
March 5, 2026 at 3:20 pmВсе о стройке https://dobdom.ru и ремонте: полезные статьи о строительстве домов, ремонте квартир, отделке помещений и выборе материалов. Советы специалистов, инструкции, идеи для интерьера и практические рекомендации по строительству и благоустройству жилья.
proposal Barcelona 40
March 6, 2026 at 2:24 amFound a bride? marriage proposal in Barcelona romantic scenarios, beautiful locations, photo shoots, decor, and surprises for the perfect declaration of love. Make your engagement in Barcelona an unforgettable moment in your story.
arbitrazhnyy yurist 14
March 6, 2026 at 3:38 amНужен юрист? юрист арбитражный суд цены представительство в арбитражном суде, защита интересов бизнеса, взыскание задолженности, споры по договорам и сопровождение судебных процессов для компаний и предпринимателей.
kran privarnoy 52
March 6, 2026 at 3:53 amИщешь кран? краны под сварку для трубопроводов различного назначения. Надежная запорная арматура для систем водоснабжения, отопления, газа и промышленных магистралей. Высокая герметичность, долговечность и устойчивость к нагрузкам.
propose 953
March 8, 2026 at 6:14 pmHow to propose to a girl proposal in barcelona
tga-info 489
March 8, 2026 at 9:21 pmИнформационный портал https://tga-info.ru обо всем: статьи о технологиях, здоровье, образе жизни, финансах, путешествиях и саморазвитии. Полезные советы, интересные факты и актуальные материалы для тех, кто хочет узнавать новое каждый день.
nesmetnoe 700
March 8, 2026 at 9:21 pmПортал о строительстве https://nesmetnoe.ru и ремонте: технологии возведения домов, отделка помещений, выбор строительных материалов и инструмента. Полезные статьи, инструкции, советы специалистов и идеи для обустройства жилья.
lifeoflove 18
March 8, 2026 at 9:24 pmОнлайн-журнал https://lifeoflove.ru для женщин о красоте, моде, здоровье и отношениях. Полезные советы по уходу за собой, статьи о психологии, семье, стиле и саморазвитии. Идеи для вдохновения, гармонии и счастливой жизни.
zakazat naves 90
March 8, 2026 at 9:53 pmнавес для машины на дачу установка навесы для дачи цена
hardexpert 201
March 8, 2026 at 10:17 pmСайт новостей https://hardexpert.net компьютерного мира: технологии, программное обеспечение, компьютерное железо и гаджеты. Свежие новости IT, обзоры устройств, аналитика и полезные материалы о современных цифровых технологиях.
hyundai-sto 765
March 8, 2026 at 10:19 pmВсе про автомобили https://hyundai-sto.ru новости автопрома, обзоры новых моделей, технические характеристики, советы по выбору машины и обслуживанию. Полезные статьи о ремонте, эксплуатации, тюнинге и современных технологиях автомобильной индустрии.
greendachnik 231
March 8, 2026 at 11:05 pmИнформационный журнал https://greendachnik.ru для садоводов и дачников. Статьи о саде, огороде и ландшафтном дизайне, советы по посадке и уходу за растениями, идеи оформления участка и рекомендации по созданию уютного сада.
idealnaya-ya 437
March 8, 2026 at 11:13 pmЖенский портал https://idealnaya-ya.ru о красоте, здоровье, отношениях и стиле. Полезные советы для женщин, идеи для ухода за собой, моды, семьи и гармоничной жизни.
allsekrets 732
March 8, 2026 at 11:14 pmВсе женские секреты https://allsekrets.ru сайт о красоте, здоровье, отношениях и стиле жизни. Полезные советы по уходу за собой, психологии, моде, семье и саморазвитию. Идеи для вдохновения, гармонии и счастливой жизни современной женщины.
profsmeta3dn 762
March 9, 2026 at 12:13 amСайт о строительстве https://profsmeta3dn.ru и ремонте: полезные советы по строительству домов, ремонту квартир и отделке помещений. Обзоры строительных материалов, инструкции по работам и рекомендации специалистов для обустройства дома.
dobdom 855
March 9, 2026 at 12:13 amВсе о стройке https://dobdom.ru и ремонте — полезные статьи о строительстве домов, ремонте квартир, отделке помещений и выборе материалов. Практические советы мастеров, инструкции по строительным работам и идеи для обустройства дома.
Roberttok
March 9, 2026 at 12:15 amДоставка пиццы https://kosmopizza.ru в саратове, закажи по номеру 71-55-55
kartremont 494
March 9, 2026 at 12:57 amМы выполняем работы https://kartremont.ru “от и до”: демонтаж, черновые и чистовые работы, установку сантехники, электрики, отделку стен, пола, потолка, кондиционеров, вентиляции, мебели и клининг.
sysadmin 189
March 9, 2026 at 2:25 amУслуги по настройке https://sysadmin.guru и администрированию серверов и компьютеров. Установка систем, настройка сетей, обслуживание серверной инфраструктуры, защита данных и техническая поддержка. Помогаем обеспечить стабильную работу IT-систем.
unblocked games 376
March 9, 2026 at 2:52 amA website with unblocked games for free online play. Popular browser games, arcades, platformers, racing games, and puzzles are available with no downloads or restrictions on any device.
grand-screen 648
March 9, 2026 at 10:03 amA platform for searching https://grand-screen.com and comparing mobile apps. Explore features, reviews, ratings, and user feedback. The Android and iOS app catalog helps you find the best services for work, communication, and entertainment.
angelmu 882
March 9, 2026 at 10:07 amСвежие новости сайт сми с оперативными новостями из России и мира. Политика, экономика, технологии, общество, культура и другие важные темы. Актуальная информация, аналитика и комментарии экспертов.
sdhhbsteel 584
March 9, 2026 at 10:21 amПортал о строительстве https://sdhhbsteel.com и промышленности: новости отрасли, технологии, оборудование, строительные материалы и производственные решения. Полезная информация, аналитика и обзоры для специалистов и компаний.
drel-interskol 563
March 9, 2026 at 10:23 amОбзоры дрелей https://drel-interskol.ru и электроинструмента для дома и профессиональной работы. Сравнение моделей, характеристики, преимущества и недостатки популярных дрелей. Полезные советы по выбору инструмента для ремонта, строительства и бытовых задач.
certif-test 66
March 9, 2026 at 11:52 amСертификация товаров http://www.certif-test.ru представляет собой официальный процесс подтверждения соответствия продукции установленным стандартам качества, безопасности и экологичности. В основе этого понятия лежит проверка изделий независимыми органами на предмет соблюдения нормативов, таких как ГОСТ, ISO или отраслевые требования. Что такое сертификация товаров? Это не просто формальность, а комплекс мер, включающих лабораторные тесты, аудит производства и выдачу сертификата, который служит доказательством надежности продукта. Без сертификации многие товары не допускаются на рынок, особенно в сферах пищевой промышленности, электроники и медицинских изделий, где риски для здоровья потребителей особенно высоки.
vnii-certification 870
March 9, 2026 at 11:52 amСертификация товаров http://www.vnii-certification.ru это процесс официального подтверждения соответствия продукции установленным стандартам качества, безопасности и экологичности. В современном мире, где потребители все чаще обращают внимание на надежность и происхождение товаров, сертификация играет ключевую роль в обеспечении доверия на рынке. Она помогает производителям и поставщикам демонстрировать, что их продукция соответствует нормам, а также защищает интересы покупателей. Существуют различные типы сертификации товаров, которые можно разделить на обязательную и добровольную, каждая из которых имеет свои особенности и цели. В этой статье мы разберем, что такое сертификация товаров и почему она важна для бизнеса и потребителей.
JasonHow
March 9, 2026 at 11:55 amЧитать больше на сайте: https://aromatmasla.ru/pachuli/ispolzovanie-masel-pachuli-dlya-deneg.html
center-sertifikaciya 43
March 9, 2026 at 1:01 pmСертификация товаров http://center-sertifikaciya.ru это важный этап для подтверждения качества и безопасности продукции, который позволяет производителям и поставщикам выходить на рынок с уверенностью в соответствии нормам. Процесс получения сертификата включает несколько ключевых шагов, начиная от подготовки документов и заканчивая выдачей официального документа. Это не только обязательное требование для многих видов товаров, но и способ повысить доверие потребителей. В этой статье мы разберем основные этапы сертификации, чтобы вы могли лучше понять, как получить сертификат на товар и избежать распространенных ошибок.
avto arenda sochi 205
March 9, 2026 at 2:02 pmПрокат авто центральный Сочи https://avto-arenda-sochi.ru
outreachseo 945
March 9, 2026 at 2:08 pmSEO-продвижение https://outreachseo.ru сайта для роста посещаемости и увеличения продаж. Проводим аудит, оптимизацию структуры, работу с контентом и техническими параметрами сайта, чтобы улучшить позиции в поисковых системах и привлечь целевой трафик.
MatthewPsymn
March 9, 2026 at 2:10 pmказино монро официальный сайт https://steeltreyd.ru
montazh konditsionerov 822
March 9, 2026 at 6:22 pmНужен кондиционер? установка кондиционера в Москве мы устанавливаем все марки и модели кондиционеров, сплит-системы, мультисплит-системы, кассетные, канальные и напольно-потолочные. Также предоставляем сопутствующие услуги автовышки или альпиниста, оказываем гарантийное и сервисное обслуживание.
DavidPaG
March 9, 2026 at 8:47 pmПрофессиональное SEO-продвижение https://outreachseo.ru сайтов для бизнеса. Анализ конкурентов, оптимизация структуры и контента, улучшение технических параметров и развитие сайта для роста позиций в поисковых системах и увеличения целевого трафика.
Davidemoth
March 9, 2026 at 9:59 pmExplore detailed insights on imax large pendulum wall clocks at TopXClocks, including features, comparisons, and expert recommendations for smarter buying decisions.
CliftonCaw
March 10, 2026 at 2:03 amCurrent weather in Podgorica in April, today and in the coming days. Accurate forecast of temperature, precipitation, wind, and humidity. Find out what the weather is like in Podgorica now, the weekly forecast for the month, and weather trends in Montenegro’s capital.
ChesterCob
March 10, 2026 at 2:34 amцены женских колец https://kolca-pomolvka-msk.ru
ThomasEpilt
March 10, 2026 at 3:07 amNolimit City – это про дерзкие темы, нестандартные механики и очень “нервные” бонуски, поэтому выбирать тайтлы наугад не всегда удобно: один слот может быть супер агрессивным, другой – чуть более терпимым по темпу, но всё равно с характером. Мы ведём Telegram-канал про Nolimit City: обзоры, рекомендации по играм, разборы фишек и подборки того, что реально стоит попробовать. Ссылка на канал: https://t.me/s/nolimitcity_slots
Timothymof
March 10, 2026 at 4:47 amПочти никто не любит верификацию, но иногда без неё никак – особенно если планируете выводить регулярно и без “подвисаний”. В таких случаях лучше сразу смотреть казино с простой верификацией, где процесс проходит быстро и без бесконечной переписки с поддержкой. В нашем Telegram мы собираем площадки, где обычно хватает стандартного набора документов, всё делается по понятной схеме и без неожиданных требований “принесите ещё одно фото”. Плюс отмечаем важные нюансы: сроки проверки, частые причины отказов и что лучше подготовить заранее, чтобы не терять время.
CliftonCaw
March 10, 2026 at 6:22 amExplore detailed insights on https://topxclocks.com/ihome-idl91-dual-charging-stereo-fm-radio-clocks/ ihome idl91 dual charging stereo fm radio clocks at TopXClocks, including features, comparisons, and expert recommendations for smarter buying decisions.
tga-info 320
March 10, 2026 at 7:09 amИнформационный портал https://tga-info.ru со статьями и обзорами на разные темы. Материалы о технологиях жизни работе доме и повседневных вопросах. Актуальные новости полезные советы рекомендации и интересная информация для читателей.
nesmetnoe 47
March 10, 2026 at 7:26 amИнтернет ресурс http://www.nesmetnoe.ru/ с полезными статьями советами и обзорами. Материалы о жизни здоровье технологиях доме и повседневных вопросах. Практические рекомендации интересные факты и актуальная информация для широкой аудитории.
lifeoflove 261
March 10, 2026 at 7:48 amСтатьи о любви https://lifeoflove.ru отношениях, психологии и семейной жизни. Советы по гармоничным отношениям общению и саморазвитию. Полезные рекомендации вдохновляющие истории и материалы для тех кто хочет улучшить личную жизнь.
greendachnik 757
March 10, 2026 at 8:25 amПолезные материалы https://greendachnik.ru для дачников и садоводов. Советы по выращиванию овощей цветов и плодовых растений уходу за садом огородом и участком. Практические рекомендации идеи для дачи и комфортной загородной жизни.
hardexpert 482
March 10, 2026 at 9:02 amМатериалы о компьютерах https://hardexpert.net технологиях электронике и IT. Обзоры техники советы по выбору комплектующих настройке программ и использованию устройств. Полезная информация для пользователей и любителей технологий.
hyundai-sto 228
March 10, 2026 at 1:12 pmИнформация о ремонте https://hyundai-sto.ru обслуживании и диагностике автомобилей Hyundai. Советы по техническому обслуживанию выбору запчастей и эксплуатации автомобиля. Полезные материалы для владельцев и автолюбителей.
idealnaya-ya 89
March 10, 2026 at 1:18 pmМатериалы о красоте http://www.idealnaya-ya.ru здоровье саморазвитии и уходе за собой. Советы по питанию фитнесу психологии и гармоничной жизни. Полезные статьи рекомендации и идеи для улучшения самочувствия и образа жизни.
angelmu 746
March 10, 2026 at 3:16 pmИнтересуют новости? свежие новости главные новости дня на одном портале. Свежие события из политики, экономики, общества, технологий и культуры. Оперативная информация, аналитика, комментарии экспертов и важные факты, которые помогают понимать происходящее.
DonaldGlada
March 10, 2026 at 4:13 pmЛучшие сервера подобрать VPS сравнение dedicated servers по цене, производительности и надежности. Рейтинг хостингов, которые предлагают мощные серверные решения.
DavidHor
March 10, 2026 at 4:21 pmНайти лучший сервер Отзывы о хостинге рейтинг dedicated servers от популярных хостинг-провайдеров. Сравните выделенные серверы по характеристикам, стоимости и возможностям масштабирования для бизнеса и веб-проектов.
Georgevow
March 10, 2026 at 4:30 pmНужен сервер? рейтинг VPS хостингов dedicated servers с мощными процессорами, NVMe SSD и высокой стабильностью. Подберите оптимальный сервер для бизнеса, разработки и высоких нагрузок.
Damianelode
March 10, 2026 at 4:38 pmИщешь сервер? подобрать качественный VPS сравнение dedicated server хостинга по характеристикам, цене, производительности и uptime. Лучшие провайдеры для размещения сайтов, интернет-магазинов и крупных проектов.
HerbertMom
March 10, 2026 at 10:09 pmОбзор и рейтинги серверов подобрать виртуальный сервер сравните выделенные серверы по характеристикам, цене, процессорам и дискам SSD. Выберите надежный сервер для размещения сайтов, приложений и высоких нагрузок.
Michaelbog
March 10, 2026 at 10:10 pmРейтинги серверов Отзывы о хостинге актуальный рейтинг dedicated server хостинга с сравнением характеристик, стоимости и производительности. Найдите оптимальный сервер для бизнеса, интернет-магазина, SaaS-сервисов и крупных сайтов.
Stuartemeni
March 10, 2026 at 10:14 pmГарантированное лечение вызов нарколога на дом цена специалист приезжает к пациенту, проводит детоксикацию организма, помогает снять симптомы алкогольной интоксикации и контролирует состояние. Безопасный и конфиденциальный подход.
Williamimali
March 10, 2026 at 10:14 pmПроблемы с алкоголем? вызвать нарколога на дом медицинская помощь при алкогольной зависимости, детоксикация организма и восстановление самочувствия. Консультации специалистов и безопасное лечение.
Joshuamosse
March 10, 2026 at 11:33 pmПрофессиональный вывод из запоя цены детоксикация организма, помощь при алкогольной интоксикации и восстановление самочувствия пациента. Специалист приезжает на дом и оказывает профессиональную помощь.
GabrielPhevy
March 10, 2026 at 11:35 pmДобровольная сертификация http://сертификация-соответствия.рф товаров, в отличие от обязательной, не является принудительной, но предоставляет значительные преимущества для бизнеса. Производители могут добровольно сертифицировать свою продукцию по стандартам ISO, ГОСТ Р или другим системам, чтобы повысить конкурентоспособность. Среди ключевых преимуществ — укрепление репутации бренда, расширение рынков сбыта, включая экспорт, и привлечение лояльных клиентов, которые предпочитают сертифицированные товары. Например, добровольная сертификация на экологичность может стать преимуществом в глазах потребителей, ориентированных на устойчивость. В итоге, такая сертификация не только повышает доверие, но и способствует росту продаж и улучшению качества продукции.
MichaelGof
March 10, 2026 at 11:35 pmGoooto: https://goooto.ru Информационный портал о женском и мужском здоровье. Статьи об ЭКО, методах диагностики, лечении гинекологических заболеваний и планировании беременности.
Michaelcon
March 11, 2026 at 12:38 amКруглосуточный вывод из запоя с выездом специалист проводит детоксикацию организма, помогает снять симптомы алкогольной интоксикации и контролирует состояние пациента. Медицинская помощь оказывается конфиденциально и направлена на быстрое восстановление самочувствия.
Warrenshoub
March 11, 2026 at 12:40 amГарантированный безопасный запой вывод на дому недорого вывод из запоя с наблюдением, детоксикацией организма и поддержкой врача. Процедуры направлены на восстановление состояния пациента и улучшение самочувствия.
RobertGax
March 11, 2026 at 12:42 amНеобходимые документы http://tehnicheskie-reglamenti.ru для процесса получения сертификата включают техническую документацию на товар, такую как паспорт изделия, инструкции по эксплуатации и результаты внутренних тестов. Также потребуются учредительные документы компании, контракты с поставщиками и, в некоторых случаях, протоколы испытаний от независимых лабораторий. Рекомендуется заранее проконсультироваться с экспертами, чтобы собрать полный пакет и ускорить процедуру. Это особенно важно для импортеров, так как несоответствие может привести к задержкам на таможне.
Wilmerinsap
March 11, 2026 at 1:33 amОсновные этапы сертификации http://sertifikati-sootvetstviya.ru товаров начинаются с анализа требований. Сначала необходимо определить тип сертификата — добровольный или обязательный — в зависимости от категории продукции, такой как электроника, пищевые продукты или строительные материалы. Далее следует сбор и подача документов в аккредитованный орган по сертификации. После этого проводится лабораторное тестирование образцов, где проверяется соответствие стандартам ГОСТ или международным нормам. Завершающим этапом является аудит производства и выдача сертификата, если все требования соблюдены.
Davidtiz
March 11, 2026 at 1:33 amВажность сертификации http://sertifikaciya-rf.ru для бизнеса невозможно переоценить, поскольку она открывает двери для расширения рынков и повышения конкурентоспособности. Компании, прошедшие сертификацию, получают преимущество в тендерах, экспорте и партнерствах, так как их продукция воспринимается как более надежная. Кроме того, сертификат помогает минимизировать юридические риски, связанные с претензиями потребителей или регуляторными штрафами. Для бизнеса сертификация — это инвестиция в репутацию и долгосрочный рост, позволяющая выделиться среди конкурентов и завоевать доверие клиентов.
StanleyVix
March 11, 2026 at 1:34 amОбязательная сертификация http://organ-sertifikacii.ru товаров предусмотрена законодательством и является необходимым требованием для определенных категорий продукции. Согласно нормам Таможенного союза ЕАЭС и российскому законодательству, такие товары, как электроника, детские изделия, пищевая продукция и медицинские приборы, должны проходить обязательную проверку на соответствие техническим регламентам. Это обеспечивает безопасность для здоровья и жизни потребителей, предотвращая попадание на рынок некачественной или опасной продукции. Процесс включает лабораторные испытания, аудит производства и выдачу сертификата соответствия. Без такой сертификации реализация товаров может быть запрещена, что подчеркивает ее роль в соблюдении правовых норм и защите рынка.
Andrewreirl
March 11, 2026 at 1:36 amНаш магазин https://atmosfera-market.ru является официальным дилером климатической техники. В каталоге магазина большой выбор проверенных марок и моделей кондиционеров, которые можно Купить с доставкой и установкой в Москве, Цена зависит от параметров, которые приводятся в карточках товаров. У нас можно не только купить климатические системы. Мы занимаемся также установкой, а качественный монтаж это очень важно для данного оборудования. Предоставляем гарантию на всю технику и работы.
Patrickinfat
March 11, 2026 at 8:35 amпиццерии рядом воронеж пицца с доставкой
Jefferytub
March 11, 2026 at 8:52 amТОП площадка https://spark.ru/user/267982/blog/309941/ggdrop-ndash-luchshij-sajt-dlya-otkritiya-kejsov-cs2-i-viigrisha-skinov для кейсов CS2 с большим выбором кейсов, честными шансами и быстрым выводом скинов. Открывайте кейсы Counter-Strike 2, получайте редкие предметы и участвуйте в розыгрышах. Удобный интерфейс, бонусы для новых игроков и регулярные обновления.
FrankNut
March 11, 2026 at 8:57 amОбновлено сегодня: Лечебная физкультура: Путь к восстановлению и здоровью
Patrickinfat
March 11, 2026 at 12:10 pmReputable service facebook accounts for scaling ads publishes detailed product cards showing account age, verification status, included assets, and exact pricing tiers. The knowledge base includes working guides for account warming, ad launch protocols, and reinstatement check procedures for reference. Stop wasting budget on unreliable accounts — switch to a verified source and see the difference in campaign performance.
Davidtiz
March 11, 2026 at 12:14 pmWholesale supplier fb accounts for sale online enables teams to source diverse account portfolios across platforms and geos from a single centralized marketplace. The marketplace serves a global buyer base with English-speaking support available via Telegram for product selection and order management. The most successful media buying teams share one trait: they invest in quality infrastructure before they invest in ad spend.
Jefferytub
March 11, 2026 at 12:15 pmCertified platform more info tracks account health metrics proactively and notifies buyers of any status changes during the guarantee period. Bulk buyers benefit from volume discounts, dedicated account managers, and priority restocking that ensures uninterrupted supply for active campaigns. Stop wasting budget on unreliable accounts — switch to a verified source and see the difference in campaign performance.
FrankNut
March 11, 2026 at 12:26 pmReliable source check it out connects advertisers with thoroughly vetted profiles backed by replacement guarantees and dedicated support. The knowledge base includes working guides for account warming, ad launch protocols, and reinstatement check procedures for reference. Marketplace standards ensure that every account performs as described — no surprises at checkout, login, or campaign launch.
outreachseo 912
March 11, 2026 at 1:27 pmКачественное SEO https://outreachseo.ru продвижение сайта для бизнеса. Наши специалисты предлагают эффективные решения для роста позиций в поисковых системах. Подробнее об услугах и стратегиях можно узнать на сайте
FrankNut
March 11, 2026 at 2:49 pmTop-rated dealer buy yahoo mail accounts has been serving the media buying community since 2020 with consistent product quality and responsive customer support. Step-by-step documentation accompanies every order, covering login procedure, security setup, and recommended first actions after access. Every order comes with clear documentation, replacement guarantees, and access to a growing knowledge base of operational resources.
Jefferytub
March 11, 2026 at 2:50 pmVerified marketplace see more provides access to a wide catalog of digital profiles for advertising and media buying. Aged profiles with natural activity patterns consistently outperform fresh registrations in ad delivery quality and checkpoint avoidance rates. From first purchase to ongoing scaling, the platform supports every stage of a media buyer’s operational journey.
Patrickinfat
March 11, 2026 at 2:51 pmLeading store — Generic — gives media buyers access to aged, warmed, and verified profiles sorted by geo, trust level, and ad readiness. The marketplace serves a global buyer base with English-speaking support available via Telegram for product selection and order management. Invest in verified account infrastructure and redirect the time saved from troubleshooting into actual campaign optimization work.
Davidtiz
March 11, 2026 at 3:02 pmFull-service dealer ad platform accounts google goes beyond selling by providing operational guides, restriction breakdowns, and platform update summaries. Product cards display exact specifications including account age, verification level, included assets, geo origin, and current stock availability. The combination of product quality, transparent specs, and responsive support creates a reliable foundation for scaling ad operations.
Patrickinfat
March 11, 2026 at 4:59 pmProfessional service buy multiple facebook accounts specializes in accounts optimized for paid campaigns with proper warming history and platform trust markers. Bulk buyers benefit from volume discounts, dedicated account managers, and priority restocking that ensures uninterrupted supply for active campaigns. Whether you need accounts for testing or production campaigns, the catalog covers every tier from entry-level to premium.
soloha 562
March 11, 2026 at 5:04 pmЖіночий онлайн https://soloha.in.ua портал з корисними статтями про моду, красу, здоров’я та стосунки. Поради щодо догляду за собою, психології, сім’ї та кар’єри. Актуальні тренди, лайфхаки та натхнення для сучасних жінок.
notatky 192
March 11, 2026 at 5:08 pmПояснюємо складні теми https://notatky.net.ua простими словами. Публікуємо зрозумілі статті про технології, фінанси, науку, закони та інші важливі питання. Читайте розбірки та корисні пояснення.
pensioneram 970
March 11, 2026 at 5:09 pmІнформаційний портал https://pensioneram.in.ua для пенсіонерів України Корисні поради про пенсії, соціальні виплати, пільги, здоров’я та повсякденне життя. Актуальні новини, рекомендації фахівців та прості пояснення важливих змін законодавства.
FrankAmoca
March 11, 2026 at 5:31 pmEstablished supplier buy unlimited business manager maintains the largest selection of quality accounts with transparent specs and competitive pricing for bulk buyers. Detailed usage guides help buyers understand the differences between softreg, selfreg, farmed, and reinstated account types before purchasing. The combination of product quality, transparent specs, and responsive support creates a reliable foundation for scaling ad operations.
KevinLow
March 12, 2026 at 12:09 amSports betting at Mostbet edu.pl. The platform offers a wide range of events, high odds, bonuses, and a user-friendly mobile app. Place bets on football, hockey, tennis, and other sports.
Shawndat
March 12, 2026 at 12:09 amMostbet bookmaker biz.pl offers betting on sports, esports, and online games. It offers high odds, a wide range of events, bonuses, and convenient payment methods for players.
Richardalepe
March 12, 2026 at 12:11 amAlmastriga: Relics of Azathoth almastriga.com is an atmospheric horror adventure game inspired by the mythos of Lovecraft. Explore eerie locations, uncover ancient secrets, and find relics of Azathoth in a world full of mysteries and dangers.
Timothyexott
March 12, 2026 at 12:12 amLust Theory Seasons http://www.lust-theory.com 1, 2, and 3 are a popular visual novel with a captivating plot, action choices, and a diverse cast of characters. Follow the story as it unfolds, make decisions, and unlock new storylines.
Michaelthync
March 12, 2026 at 2:16 amDive into Lust Academy https://lustacademy.org and explore all seasons of this popular visual novel. Learn about the characters, story, and interactive storytelling possibilities.
Williammaict
March 12, 2026 at 2:18 amMy Cute Roommate my cute roommate is the official website for the visual novel with a captivating storyline and interactive solutions. Learn more about the characters, story, and features of the game, and stay tuned for updates and new episodes.
RogerGueme
March 12, 2026 at 2:19 amPerfect Date official perfect date website offers detailed information about the characters, plot, and gameplay features. Read the news and stay up-to-date on the latest updates.
KennethCesty
March 12, 2026 at 2:19 amOperation Lovecraft operation-lovecraft Official Game Guide for players who want to learn more about the plot, missions, and characters. Helpful tips, hints, and detailed guides will help you complete the game and unlock all storylines.
JosephShubs
March 12, 2026 at 4:46 amstone bazaar online – Browsed the page today and everything was easy to read.
ChristopherShubs
March 12, 2026 at 6:01 amlavender market online – I checked out the page and everything appeared properly organized.
JosephShubs
March 12, 2026 at 7:11 amlantern bazaar online – I browsed the site and the content was easy to understand.
ChristopherShubs
March 12, 2026 at 8:21 ambrook market online – I opened the website today and liked how everything was arranged.
MatthewShubs
March 12, 2026 at 9:32 amvisit this outlet page – I ran into the site today and noticed some helpful details.
JesusKex
March 12, 2026 at 9:42 amDownload Subverse sub-verse and dive into a forbidden galaxy full of adventure, strategy and unique characters. Explore new worlds, command your crew and experience an epic sci-fi journey in this action-packed space game.
Erickser
March 12, 2026 at 9:49 amTreasure of Nadia http://www.treasure-of-nadia.org Official Game Site with detailed information about the adventure game. Read news, learn about the characters, and learn about the gameplay features.
7krasotok 152
March 12, 2026 at 9:50 amЖенский портал https://7krasotok.com о красоте, здоровье, моде и отношениях. Полезные советы, статьи о семье, психологии и саморазвитии. Читайте рекомендации экспертов, узнавайте о трендах и находите вдохновение для гармоничной жизни.
krasotka 446
March 12, 2026 at 9:51 amЖенский онлайн https://krasotka-fl.com.ua портал с полезными материалами о красоте, здоровье, моде и отношениях. Советы по уходу за собой, психологии и саморазвитию для современной женщины.
DavidLot
March 12, 2026 at 10:43 amОнлайн казино pin up вход с большим выбором слотов, настольных игр и бонусных предложений. Платформа предлагает удобный интерфейс, популярные игровые автоматы и различные способы оплаты.
Ashleykiz
March 12, 2026 at 10:45 amЛучшее казино https://россиягоржусь.рф платформа для онлайн игр с большим выбором слотов и настольных развлечений. Бонусные предложения и удобный интерфейс делают игру комфортной.
GeorgeHek
March 12, 2026 at 10:50 amЛюбишь азарт? https://school57.ru предлагает разнообразные игровые автоматы, настольные игры и интересные бонусные программы. Платформа создана для комфортной игры и предлагает широкий выбор развлечений.
Gilbertlom
March 12, 2026 at 11:42 amБольшой выбор автоматов https://ekolip.ru настольных развлечений и бонусных предложений делает игру более разнообразной. Пин Ап казино предлагает пользователям популярные слоты и удобную игровую платформу.
Richarddut
March 12, 2026 at 11:42 amРазнообразные игровые автоматы вход в пин ап настольные развлечения доступны на популярной игровой платформе. Пин Ап казино предлагает большой каталог слотов и удобный интерфейс для пользователей.
RalphBah
March 12, 2026 at 11:46 amНужен банный веник? купить эвкалиптовый веник натуральные банные веники помогают улучшить эффект парения и создать особую атмосферу в бане. У нас можно купить веник для бани из березы, дуба или эвкалипта.
StevenShubs
March 12, 2026 at 11:55 amdiscover lemon stone – Came across this site and found valuable details almost immediately.
JamesMup
March 12, 2026 at 12:26 pmНужен банный веник? веники для бани натуральные банные веники помогают улучшить эффект парения и создать особую атмосферу в бане. У нас можно купить веник для бани из березы, дуба или эвкалипта.
DenverHib
March 12, 2026 at 12:27 pmПротивопожарные двери https://zavod-dverimontazh.moscow от производителя с профессиональной установкой в Москве. Изготовление по ГОСТ, сертифицированные конструкции с высокой огнестойкостью. Металлические противопожарные двери для офисов, складов, жилых и коммерческих зданий. Доставка, монтаж, гарантия качества и выгодные цены.
KennethShubs
March 12, 2026 at 1:07 pmthis online emporium – Checked the page today and it matched similar topics I was looking for.
KevinShubs
March 12, 2026 at 2:20 pmexplore this emporium – I visited the website and found the content friendly and informative.
EdwardShubs
March 12, 2026 at 3:31 pmmaplebrookmarket – Quick visit today but everything looks neat and well explained.
DonaldShubs
March 12, 2026 at 4:44 pmcheck this boutique – Took a look at the page and the website felt neat and organized.
JasonShubs
March 12, 2026 at 6:00 pmsee the marble shop – I came across the site and it looked very appealing to check out.
JeffreyShubs
March 12, 2026 at 7:14 pmthis online boutique – Useful insights here make me want to return soon.
GeorgeHek
March 12, 2026 at 7:34 pmЛюбишь азарт? https://school57.ru предлагает разнообразные игровые автоматы, настольные игры и интересные бонусные программы. Платформа создана для комфортной игры и предлагает широкий выбор развлечений.
JacobShubs
March 12, 2026 at 8:29 pmthis bazaar website – Browsed the page and everything seems clear and easy to use.
JacobShubs
March 12, 2026 at 9:40 pmexplore this bazaar – Came across the website and the layout is clean and helpful.
BrandonShubs
March 13, 2026 at 1:10 amemporium marketplace – Initial visit feels good; information is clear and easy to understand.
newsn 845
March 13, 2026 at 11:15 amНовостной портал https://newsn.ru — свежие новости России и мира, политика, экономика, общество, технологии и культура. Оперативные публикации, аналитические материалы и главные события дня. Узнавайте важные новости первыми и следите за развитием событий онлайн.
dipris-studio 134
March 13, 2026 at 11:15 amВсе о строительстве https://dipris-studio.ru и дизайне загородного дома: современные проекты, идеи планировки, выбор материалов, этапы строительства и оформление интерьера. Полезные советы по строительству коттеджей, ремонту и благоустройству участка. Практические рекомендации для владельцев домов и тех, кто только планирует строительство.
vekneboley 390
March 13, 2026 at 11:17 amПортал про здоровье https://vekneboley.ru с полезными статьями о профилактике заболеваний, правильном питании, иммунитете и здоровом образе жизни. Рекомендации специалистов, советы по поддержанию здоровья, физической активности и улучшению самочувствия каждый день.
hand-store 694
March 13, 2026 at 11:17 amПортал новостей https://hand-store.ru о высоких технологиях и IT-индустрии. Последние события в мире программирования, искусственного интеллекта, стартапов, гаджетов и цифровых технологий. Читайте обзоры, аналитические материалы и важные новости технологического рынка.
sportdon 322
March 13, 2026 at 11:17 amВсе о строительстве https://sportdon.ru и ремонтах: рекомендации по выбору материалов, технологиям строительства, отделке помещений и дизайну интерьера. Полезные статьи для тех, кто строит дом, делает ремонт квартиры или планирует обновление интерьера.
expert-byt 910
March 13, 2026 at 1:35 pmПортал о бытовой https://expert-byt.ru технике и ее эксплуатации. Полезные статьи о выборе техники для дома, правильном использовании, уходе и продлении срока службы устройств. Советы по ремонту, обслуживанию и эффективному использованию бытовой техники в повседневной жизни.
ivanovo37 210
March 13, 2026 at 1:36 pmЧитайте свежие новости https://иваново37.рф России на новостном портале. Главные события дня, политика, экономика, общество, технологии и культура. Оперативные публикации, аналитика и важная информация о событиях в стране и мире.
novostizn 644
March 13, 2026 at 1:37 pmСвежие мировые https://novostizn.ru новости и интересные события со всех уголков планеты. Политика, экономика, технологии, культура, наука и общественная жизнь. Актуальные новости, аналитика и необычные факты о событиях, которые обсуждает весь мир.
topse 526
March 13, 2026 at 1:37 pmВсе о смартфонах https://topse.ru мобильных телефонах и гаджетах Sony. Новости, обзоры новых моделей Xperia, характеристики устройств, сравнение смартфонов и полезные советы по выбору техники. Узнайте о новинках Sony, технологиях камер, производительности и возможностях мобильных устройств.
dikb 948
March 13, 2026 at 1:37 pmМировые новости https://dikb.ru и интересные события каждый день. Самые важные события политики, экономики, технологий, науки и культуры. Свежие публикации, аналитика и необычные факты о происходящем в разных странах мира.
selcuksport 597
March 13, 2026 at 4:08 pmLive streams https://selcuksport.com.az of football matches and sports TV shows online. Football news, schedules, results, and analysis. Follow your favorite teams, watch highlights, and stay up-to-date on the latest news from the world of football.
playmods 740
March 13, 2026 at 4:09 pmPlaymods APK https://playmods.com.az is a convenient app for downloading modified games and apps on Android. It offers a large catalog of popular games, fast mod updates, additional features, and a simple interface for easy searching and installation.
zavod-dverimontazh 998
March 13, 2026 at 4:09 pmПротивопожарные двери https://zavod-dverimontazh.moscow в Москве от производителя. Надежные металлические двери с высокой огнестойкостью для жилых и коммерческих помещений. Сертификация, соответствие нормам пожарной безопасности, быстрая доставка и установка противопожарных дверей под ключ.
maksinfo 710
March 13, 2026 at 4:10 pmОбщаешься в максе? найти канал в максе удобный способ найти интересные каналы в мессенджере. Новости, технологии, бизнес, развлечения и другие категории. Просматривайте популярные каналы, открывайте новые источники информации и подписывайтесь.
PatrickApolf
March 13, 2026 at 4:10 pmЕжедневный обзор: https://elicebeauty.com/makiyazh/glaza/karandashi-dlya-glaz/karandash-dlya-glaz-slide-on-pencil.html
JamesShubs
March 13, 2026 at 5:12 pmcheck this page – Just browsed through it and found the layout clean and easy to understand.
apis-togo 453
March 13, 2026 at 6:11 pmСтроительный портал https://apis-togo.org с полезными статьями о строительстве домов, ремонте квартир и выборе строительных материалов. Советы специалистов, современные технологии строительства, идеи дизайна интерьера и практические рекомендации для ремонта и обустройства жилья.
PeterPsype
March 13, 2026 at 6:12 pmКонсультация семейного юриста поможет быстро разобраться в сложных жизненных ситуациях: развод, раздел имущества, алименты, споры о детях и брачные договоры. Перейдя по запросу [url=https://semeynyy-yurist1.ru]адвокат по семейным имущественным делам[/url] – специалист объяснит ваши права, оценит перспективы дела и предложит оптимальный план действий. Получите профессиональную юридическую помощь и ответы на все вопросы по семейному праву.
eeu-a 961
March 13, 2026 at 6:12 pmСтроительный журнал https://eeu-a.kiev.ua о строительстве, ремонте и дизайне. Полезные статьи о строительных технологиях, выборе материалов, отделке помещений и обустройстве дома. Практические советы для тех, кто строит дом или делает ремонт.
elektrod 81
March 13, 2026 at 6:13 pmВсе о строительстве https://elektrod.com.ua и ремонте на строительном портале. Советы по выбору строительных материалов, технологиям строительства, отделке помещений и дизайну интерьера. Полезные рекомендации для владельцев домов, квартир и загородной недвижимости.
furbero 911
March 13, 2026 at 6:13 pmСтроительный портал https://furbero.com с полезной информацией о строительстве домов, ремонте квартир и отделке помещений. Советы по выбору материалов, современные технологии строительства и идеи дизайна интерьера для комфортного жилья.
novostroi 50
March 13, 2026 at 6:14 pmПолезные статьи https://novostroi.in.ua о строительстве и ремонте на строительном портале. Технологии строительства, выбор материалов, отделка помещений и дизайн интерьера. Практические рекомендации для строительства дома и ремонта квартиры.
DavidShubs
March 13, 2026 at 6:23 pmbrowse this shop – Spotted the site while surfing the web and the info there seemed worthwhile.
JamesShubs
March 13, 2026 at 7:08 pmrandom site I found – I just discovered this page and had a quick scroll through it, the layout seemed neat.
JohnShubs
March 13, 2026 at 7:33 pmexplore harbor shop – I visited briefly and the website was pleasant to read through.
Waltercew
March 13, 2026 at 8:02 pmБесплатная консультация юриста — это возможность получить профессиональную правовую помощь без оплаты. Перейдя по запросу [url=https://vk.com/pravovik24]юридическая помощь[/url] вы получите поддержку специалиста, который выслушает вашу ситуацию, оценит риски и подскажет возможные варианты решения: от подготовки документов до защиты интересов в суде. Такая консультация помогает понять свои права, избежать ошибок и выбрать правильную стратегию действий.
ScottShubs
March 13, 2026 at 8:03 pmonline vendor portal – Just visited and the pages feel smooth, tidy, and easy to browse.
JamesShubs
March 13, 2026 at 8:08 pminteresting page – Landed on this site earlier and took a short look around, the design seemed clean.
JamesShubs
March 13, 2026 at 8:13 pmexplore this vendor hub – Just visited this site today and it looks clear, active, and easy to explore.
carexpert 64
March 13, 2026 at 8:14 pmПортал про автомобили https://carexpert.com.ua новости автоиндустрии, обзоры новых моделей, тест-драйвы и советы по эксплуатации машин. Полезные статьи для автолюбителей о выборе автомобиля, ремонте, обслуживании и современных автомобильных технологиях.
autoiceny 467
March 13, 2026 at 8:14 pmАвтомобильный портал https://autoiceny.com.ua для автолюбителей. Свежие новости автоиндустрии, обзоры автомобилей, тест-драйвы, рекомендации по эксплуатации и обслуживанию машин. Полезная информация о современных автомобилях и автомобильных технологиях.
eurasiamobilechallenge 724
March 13, 2026 at 8:15 pmВсе об автомобилях https://eurasiamobilechallenge.com на автомобильном портале. Новости автоиндустрии, обзоры машин, тест-драйвы, советы по ремонту и обслуживанию автомобилей. Узнайте о новых моделях авто, технологиях и событиях автомобильного рынка.
mallex 244
March 13, 2026 at 8:16 pmАвтомобильный портал https://mallex.info с новостями автоиндустрии, обзорами автомобилей, тест-драйвами и полезными советами для водителей. Узнайте о новых моделях машин, технологиях автопроизводителей, обслуживании авто и последних событиях автомобильного рынка.
proektsam 261
March 13, 2026 at 8:16 pmПортал о строительстве https://proektsam.kyiv.ua и ремонте домов и квартир. Полезные статьи о строительных технологиях, выборе материалов, отделке помещений и дизайне интерьера. Советы специалистов и практические рекомендации для обустройства жилья.
RichardShubs
March 13, 2026 at 8:42 pmtake a look here – Ran into this site by accident and enjoyed browsing it for a moment.
DavidShubs
March 13, 2026 at 9:07 pminteresting store page – Came across this link not long ago and it seems like a well organized marketplace.
JamesShubs
March 13, 2026 at 9:14 pmthis vendor platform – Found this platform today and moving between sections is smooth and neat.
JosephShubs
March 13, 2026 at 9:51 pmstone market website – Found the page today and the information seemed well organized.
JohnShubs
March 13, 2026 at 10:07 pmcollective marketplace – Came across this platform earlier and it seems simple to move around.
entertainment 525
March 13, 2026 at 10:24 pmЖенский сайт https://entertainment.com.ua с полезными статьями о красоте, здоровье, моде, отношениях и саморазвитии. Советы по уходу за собой, идеи стиля, рецепты, психология и вдохновение для современной женщины. Читайте интересные материалы и находите полезные советы для повседневной жизни.
gorod-lubvi 497
March 13, 2026 at 10:25 pmИнформационный женский https://gorod-lubvi.com.ua портал о красоте, здоровье, моде, семье и отношениях. Полезные советы, идеи стиля, рецепты, психология и рекомендации для современной женщины. Узнайте, как заботиться о себе и создавать гармонию в жизни.
DavidShubs
March 13, 2026 at 10:25 pmoakstonevendorhouse – Was checking this page earlier and the layout actually feels pretty clean and easy to follow.
happytime 692
March 13, 2026 at 10:26 pmЖенский портал https://happytime.in.ua с полезными статьями о моде, красоте, здоровье, отношениях и семье. Советы по уходу за собой, рецепты, идеи стиля и вдохновение для женщин. Все самое интересное и полезное для современной женщины.
novaya 166
March 13, 2026 at 10:27 pmВсе для женщин https://novaya.com.ua на одном сайте: мода, красота, здоровье, отношения и семья. Полезные советы по уходу за собой, идеи стиля, рецепты и вдохновляющие статьи для современной женщины.
leif 525
March 13, 2026 at 10:27 pmСайт для женщин https://leif.com.ua с полезными советами о красоте, здоровье, моде и отношениях. Статьи о саморазвитии, семье, стиле жизни и уходе за собой. Узнайте секреты женской красоты и гармонии.
JamesShubs
March 13, 2026 at 10:47 pmzen bazaar marketplace – Browsed today, the platform appears lively and full of potential items.
ChristopherShubs
March 13, 2026 at 11:00 pmdiscover lavender brook – Came across the site and liked how clearly everything was arranged.
MichaelShubs
March 13, 2026 at 11:07 pmvendor resource page – I noticed this site earlier and the information looks nicely organized.
JohnShubs
March 13, 2026 at 11:36 pmthe vendor emporium – Browsed this platform today while exploring various supplier sites.
RobertShubs
March 14, 2026 at 12:06 amquick site visit – I checked this page today and the marketplace seems unique.
MatthewShubs
March 14, 2026 at 12:09 amoutlet homepage – Discovered the website today and the content looked worth reading.
JamesShubs
March 14, 2026 at 12:20 amcheck vendor bazaar online – Took a look at the site, the platform appears inviting and interesting.
martime 310
March 14, 2026 at 12:43 amЖенский сайт https://martime.com.ua о красоте, здоровье, моде и стиле жизни. Советы по уходу за собой, психология отношений, рецепты и полезные рекомендации для современной женщины. Читайте интересные статьи и вдохновляйтесь.
olive 333
March 14, 2026 at 12:44 amЖенский портал https://olive.kiev.ua о моде, красоте и здоровье. Полезные советы, рецепты, психология отношений и идеи стиля. Читайте интересные статьи и находите вдохновение для повседневной жизни.
sevgr 666
March 14, 2026 at 12:44 amВсе о строительстве https://sevgr.org.ua домов, ремонте квартир и благоустройстве жилья на строительном портале. Полезные статьи, рекомендации специалистов, современные технологии строительства и практические советы по выбору строительных материалов и отделке помещений.
tiamo 784
March 14, 2026 at 12:45 amСайт для женщин https://tiamo.rv.ua с полезными статьями о красоте, здоровье, моде, семье и отношениях. Рекомендации по уходу за собой, идеи стиля, рецепты и советы для гармоничной жизни.
RichardShubs
March 14, 2026 at 12:46 amOlive Vendor Center – Just explored this hub and the layout feels clean and user-friendly.
HowardTop
March 14, 2026 at 12:59 amремонт ванна туалет ключ ремонт ванной санузла цена
WilliamShubs
March 14, 2026 at 1:07 amvendor collective page – Just opened this platform and browsing through the items seemed smooth.
MarkShubs
March 14, 2026 at 1:16 amtheir lark market – Spent a few minutes on the site and the layout made reading comfortable.
MichaelShubs
March 14, 2026 at 1:23 amdiscover vendor treasures – Browsing felt intuitive, enjoyable, and the site responded quickly to clicks.
JamesShubs
March 14, 2026 at 1:50 amdiscover harbor bazaar – The bazaar marketplace is easy to navigate and feels welcoming.
DavidShubs
March 14, 2026 at 2:02 ambrowse maple vendor portal – Quick glance showed tidy listings and a simple, clear interface.
JosephShubs
March 14, 2026 at 2:06 amrandom vendor site – Found this page while browsing and it seems fairly promising.
JamesShubs
March 14, 2026 at 2:13 amcoastharbor finds – Marketplace is easy to navigate, with sections laid out clearly and invitingly.
StevenShubs
March 14, 2026 at 2:26 amtheir stone bazaar – First visit here and several parts of the site were genuinely useful.
JamesShubs
March 14, 2026 at 2:27 amviolet vendor online – Navigation feels effortless, with a crisp and well-organized design.
JamesShubs
March 14, 2026 at 2:53 amdiscover dunecove deals – Easy-to-navigate emporium, layout looks tidy and user-friendly.
JamesShubs
March 14, 2026 at 2:57 amcheck out bay bazaar – The site has a relaxed vibe and simple navigation for enjoyable browsing.
ThomasShubs
March 14, 2026 at 3:08 ama workshop marketplace – Took a quick look at this page today and it feels tidy.
DavidShubs
March 14, 2026 at 3:14 amexplore coaststone deals – Smooth page transitions and organized sections make browsing comfortable.
KennethShubs
March 14, 2026 at 3:35 amtake a look here – I opened the page while searching online and found it helpful.
JohnShubs
March 14, 2026 at 3:42 amhazel harbor vendor directory – Discovered this site earlier and the listings appear pretty practical.
DavidShubs
March 14, 2026 at 4:02 ambaystone treasures – Layout is organized, navigation flows nicely, and exploring is easy.
CharlesShubs
March 14, 2026 at 4:08 amthis vendor platform – Ran into this marketplace today and it looks like a nice find.
JamesShubs
March 14, 2026 at 4:12 amdiscover dune cove selections – Organized pages, navigation smooth and exploring products today was simple.
JohnShubs
March 14, 2026 at 4:12 amshop coppercove online – Layout is structured, making exploring categories and vendors easy.
DavidShubs
March 14, 2026 at 4:34 amshop vendor collective – Pleasant to browse, product details are clear, and everything looks appealing.
KevinShubs
March 14, 2026 at 4:42 amthis emporium website – Browsed the page earlier and the layout felt clear and user-friendly.
JohnShubs
March 14, 2026 at 5:07 amexplore berry cove – Product listings are organized, and navigating the site is fast and simple.
ChristopherShubs
March 14, 2026 at 5:08 amtealvendorcollective – First impression feels good navigation looked simple and clear.
RichardShubs
March 14, 2026 at 5:11 amexplore copperstone treasures – The emporium layout is clear and navigating feels smooth and relaxed.
RichardShubs
March 14, 2026 at 5:19 ambrowse hazel vendors here – I’m impressed with how neatly things are organized and how fast it loads.
RobertShubs
March 14, 2026 at 5:24 ambrowse dunestone bargains – Interface is simple, marketplace navigation was comfortable and pleasant.
EdwardShubs
March 14, 2026 at 5:50 ammaplebrookmarket – Quick visit today but everything looks neat and well explained.
DanielShubs
March 14, 2026 at 6:10 amthis vendor exchange – I discovered this platform today and the marketplace design stands out.
ThomasShubs
March 14, 2026 at 6:11 amexplore coralharbor shop – Pages load quickly, and the interface makes browsing relaxed and enjoyable.
ThomasShubs
March 14, 2026 at 6:11 amsee berrystone market – Browsing today was smooth, and the platform feels tidy and user-friendly.
WilliamShubs
March 14, 2026 at 6:37 amcheck out wave vendor – Pages respond quickly and the layout is clean and simple to use.
DavidShubs
March 14, 2026 at 6:39 amexplore echobrook deals – Marketplace is tidy, navigating sections felt simple and relaxing.
CharlesShubs
March 14, 2026 at 6:52 amvendor house directory – Just casually browsing and a handful of items here really caught my eye.
DonaldShubs
March 14, 2026 at 7:01 amonline crest store – Visited the page briefly and the content was presented in a tidy manner.
MatthewShubs
March 14, 2026 at 7:15 ambrowse this hub – I ran into this platform today and the layout loads smoothly.
CharlesShubs
March 14, 2026 at 7:16 ambrowse birch brook collections – Clean design and intuitive navigation make exploring categories simple and pleasant.
ChristopherShubs
March 14, 2026 at 7:16 amvisit coralstone bazaar – Exploring categories was effortless, with a clean and organized design.
RichardShubs
March 14, 2026 at 7:38 amvendor listings wheatbrook – Simple layout and smooth navigation make exploring vendors enjoyable.
RichardShubs
March 14, 2026 at 7:52 ambrowse echobrook deals – Layout is clear, browsing categories felt quick and easy.
AnthonyShubs
March 14, 2026 at 8:12 amtrailstone vendor house link – I checked this site today, and everything is organized and readable.
JasonShubs
March 14, 2026 at 8:13 amofficial outlet page – Visited the page and it immediately stood out to me.
MatthewShubs
March 14, 2026 at 8:14 amshop cottonbrook finds – Pages open quickly and moving through sections is effortless.
DanielShubs
March 14, 2026 at 8:15 ambirchharbor finds – Sections are intuitive to navigate, and the market feels user-friendly.
ChristopherShubs
March 14, 2026 at 8:21 amvisit this vendor hub – First time checking it out and the marketplace looks useful so far.
JosephShubs
March 14, 2026 at 8:38 amshop wheat vendor collective – The collection of vendors is nice, and browsing felt relaxed and enjoyable.
ThomasShubs
March 14, 2026 at 9:05 amshop elmharbor selections – Marketplace design looks clear and exploring items was comfortable.
DonaldShubs
March 14, 2026 at 9:14 amtrailvendoremporium – Quick browse earlier site seems simple and useful.
DonaldShubs
March 14, 2026 at 9:15 amsee cottonmeadow deals – Marketplace feels organized and navigation is smooth for checking products.
AnthonyShubs
March 14, 2026 at 9:15 ambright brook marketplace – Browsing categories is easy, thanks to the clean and intuitive design.
JeffreyShubs
March 14, 2026 at 9:17 ambrowse this boutique site – I liked the information and will probably revisit the page.
ThomasShubs
March 14, 2026 at 9:39 ambrowse acorn brook hub – The interface is pleasant and navigating listings felt smooth.
MatthewShubs
March 14, 2026 at 9:50 ambrowse marketplace here – The overall design is clean, making product exploration simple.
PaulShubs
March 14, 2026 at 10:18 amdiscover brightharbor outlet – Loading times are fast, and exploring sections today was effortless.
MarkShubs
March 14, 2026 at 10:18 amexplore the market – Came across this site earlier and it looks active with interesting content.
PaulShubs
March 14, 2026 at 10:18 amcheck out creekharbor outlet – Browsing today was simple with fast-loading pages and clear sections.
ChristopherShubs
March 14, 2026 at 10:19 amshop elmstone finds – Outlet platform pages load fast, browsing today was effortless.
JacobShubs
March 14, 2026 at 10:23 ammeadow harbor bazaar – I visited the site and the content looked genuinely helpful and well organized.
CharlesShubs
March 14, 2026 at 10:40 amacorn harbor marketplace – Nice theme overall and browsing the sections felt smooth.
MarkShubs
March 14, 2026 at 11:22 amicicle meadow online market – Just discovered this marketplace and it seems useful.
PaulShubs
March 14, 2026 at 11:22 amuplandrivervendorhub – Nice discovery while browsing vendor marketplaces online tonight.
AndrewShubs
March 14, 2026 at 11:24 amcheck out creekstone bazaar – Layout is simple, and browsing categories felt relaxed and pleasant.
KevinShubs
March 14, 2026 at 11:24 amcheck out calmcove boutique – The site is tidy, browsing is smooth, and the design is elegant.
JacobShubs
March 14, 2026 at 11:27 amofficial bazaar page – Opened the site and the information appears trustworthy and useful.
MatthewShubs
March 14, 2026 at 11:29 amexplore ember canyon selections – Marketplace design is clear and browsing products feels effortless.
ChristopherShubs
March 14, 2026 at 11:42 amvisit alpine cove emporium – Really nice design here, exploring the different sections was smooth.
KennethShubs
March 14, 2026 at 12:26 pmcrowncoveboutique – Website has a stylish boutique layout, browsing felt relaxed and seamless.
StevenShubs
March 14, 2026 at 12:26 pmmarket hub online – Found this platform and moving through listings felt very easy and quick.
JasonShubs
March 14, 2026 at 12:26 pmcalmstoneemporium – The emporium site looks great, with fast-loading pages and a pleasant design.
JonathanShubs
March 14, 2026 at 12:30 pmbrowse this market site – Checked the page today while browsing and it looked well made.
DonaldShubs
March 14, 2026 at 12:41 pmbrowse ember ridge products – Neat emporium layout, checking items today was smooth and simple.
DanielShubs
March 14, 2026 at 12:44 pmalpine stone vendor hub – First impression is positive, the site is fast and neatly arranged.
StevenShubs
March 14, 2026 at 12:50 pmopen ivory ridge marketplace – Really enjoyed browsing these products and will likely return.
KennethShubs
March 14, 2026 at 1:26 pmvendor hub page – Just discovered this marketplace and the pages were easy to move through.
BrianShubs
March 14, 2026 at 1:31 pmcrownstoneemporium – Emprorium marketplace here seems organized and friendly to explore.
EricShubs
March 14, 2026 at 1:32 pmexplore canyon harbor shop – Vendor pages are engaging, and the site has a lively bazaar feel.
ScottShubs
March 14, 2026 at 1:32 pmvisit this orchard market page – The website layout is clear and browsing around is effortless.
MatthewShubs
March 14, 2026 at 1:46 pmvisit trading marketplace here – Just checked the site and the listings look engaging.
Anthonypah
March 14, 2026 at 1:52 pmХотите, чтобы ваш профиль или группа в Одноклассниках росли быстрее? Перейдя по запросу [url=https://kwork.ru/smm/47138468/zhivie-podpischiki-odnoklassniki-ok-v-gruppu-bez-spisaniy-bez-botov]сколько стоит накрутить подписчиков в одноклассники[/url] вы сможете увеличить количество подписчиков и активность на странице. Чем больше подписчиков — тем выше доверие и интерес к вашему аккаунту. Начните развивать свою страницу уже сегодня!
PaulShubs
March 14, 2026 at 1:54 pmsee fern brook offers – Marketplace design clean, navigating items was simple and enjoyable.
AndrewShubs
March 14, 2026 at 2:28 pmivory vendor portal – Took a look at the site and everything seems organized and accessible.
JoshuaShubs
March 14, 2026 at 2:28 pmonline vendor lane – Browsing marketplaces today led me to this site, which looks promising.
EdwardShubs
March 14, 2026 at 2:37 pmcrystalcoveboutique – Lovely boutique design, navigating the site felt smooth and enjoyable.
ScottShubs
March 14, 2026 at 2:37 pmshop canyon stone online – Clean layout and quick-loading pages make exploring the marketplace simple.
BrandonShubs
March 14, 2026 at 2:38 pmdiscover moon cove – The page seems positive on first look and content is helpful.
AnthonyShubs
March 14, 2026 at 2:47 pmexplore amber cove store – The boutique vibe is appealing and the site is comfortable to explore.
AndrewShubs
March 14, 2026 at 3:08 pmexplore sale products – Browsing through listings was straightforward and each page appeared quickly.
KevinShubs
March 14, 2026 at 3:29 pmvelvet vendor collective – I explored this site today and the pages feel organized and tidy.
AndrewSow
March 14, 2026 at 3:36 pmСвежие новости https://actualnews.kyiv.ua Украины и мира на информационном новостном сайте. Политика, экономика, общество, технологии, культура и происшествия. Оперативные публикации, аналитика и комментарии экспертов. Узнавайте главные события дня и следите за развитием новостей.
Mathewgof
March 14, 2026 at 3:36 pmСайт новостей https://antifa-action.org.ua Украины и мира с актуальными событиями политики, экономики, общества и технологий. Читайте свежие новости, аналитические материалы и комментарии экспертов. Все главные события Украины и международной повестки.
ShawnHaisk
March 14, 2026 at 3:37 pmАктуальные новости https://kiev-online.com.ua Украины и мира на новостном портале. Политика, экономика, общество, технологии и культура. Свежие события, аналитика и важные новости дня.
JamesRoalf
March 14, 2026 at 3:38 pmЧитайте последние https://kiev-pravda.kiev.ua новости Украины и мира на новостном сайте. Политика, экономика, общество, технологии, культура и происшествия. Оперативные обновления и аналитические материалы.
TimothyScurn
March 14, 2026 at 3:38 pmИнформационный сайт https://mediashare.com.ua новостей Украины и мира. Свежие события политики, экономики, общества и технологий. Главные новости дня, аналитика и комментарии экспертов.
TimothyShubs
March 14, 2026 at 3:39 pmdiscover crystalstone emporium – Neat design and responsive pages make exploring items simple and calm.
JeffreyShubs
March 14, 2026 at 3:40 pmcaramelbrook shop online – Browsing today was simple, with smooth pages and a sweet design.
MarkShubs
March 14, 2026 at 3:45 pmapricot brook shop hub – Quick visit shows a smooth browsing experience.
KevinShubs
March 14, 2026 at 4:04 pmvendor studio online – Looked earlier today and the product listings are clear and practical.
KennethShubs
March 14, 2026 at 4:23 pmvisit meadow outlet – The site structure makes it comfortable to check different items.
JeffreyShubs
March 14, 2026 at 4:40 pmshop daisycove online – Organized interface with fast-loading pages made exploring effortless.
DonaldShubs
March 14, 2026 at 4:47 pmcheck apricot outlet hub – The platform appears neat and easy to navigate.
BrianShubs
March 14, 2026 at 5:36 pmopen the emporium page – Navigation is straightforward and items are easy to find.
EdwardShubs
March 14, 2026 at 5:40 pmexplore jasper vendor hub – Navigation is intuitive and browsing the marketplace felt simple.
JacobShubs
March 14, 2026 at 5:40 pmexplore daisystone deals – Clean design with intuitive pages, exploring products was enjoyable.
PaulShubs
March 14, 2026 at 5:47 pmboutique style destination – A polished boutique shop that’s intuitive and pleasant to browse.
WilliamGrect
March 14, 2026 at 5:54 pmПортал для женщин https://fotky.com.ua с интересными статьями о моде, красоте, здоровье, семье и отношениях. Полезные советы, рецепты, психология отношений и идеи стиля.
ScottHor
March 14, 2026 at 5:55 pmСайт о гипертонии https://gipertoniya.net и повышенном артериальном давлении. Полезные статьи о причинах гипертонии, симптомах, профилактике и современных методах лечения. Советы врачей, рекомендации по питанию, образу жизни и контролю артериального давления.
WilliamRut
March 14, 2026 at 5:56 pmСтроительный сайт https://ko-online.com.ua с полезными статьями о строительстве домов, ремонте квартир и выборе строительных материалов. Современные технологии строительства, советы специалистов, идеи дизайна интерьера и практические рекомендации для ремонта и обустройства жилья.
JasonSoora
March 14, 2026 at 5:57 pmСайт о финансах https://manorsgroup.com.ua и недвижимости с полезными статьями о инвестициях, покупке и продаже недвижимости, ипотеке и управлении личными финансами. Аналитика рынка, советы экспертов и актуальные новости для тех, кто интересуется финансовыми решениями и недвижимостью.
AndrewSow
March 14, 2026 at 5:57 pmМедицинский портал https://lpl.org.ua с полезными статьями о здоровье, профилактике заболеваний и современных методах лечения. Советы врачей, рекомендации по правильному питанию, укреплению иммунитета и здоровому образу жизни.
NicholasShubs
March 14, 2026 at 6:40 pmshop dawnridge finds – Simple platform structure, exploring sections was smooth.
StevenShubs
March 14, 2026 at 6:44 pmaurora stone trading hub – A lively bazaar-themed shop that feels inviting to visitors.
EdwardShubs
March 14, 2026 at 6:48 pmvisit flora brook outlet – Browsing the store was easy and pages loaded quickly.
RichardShubs
March 14, 2026 at 7:10 pmcheck out caramelcove emporium – Navigation is intuitive, and the platform layout feels neat and charming.
JasonShubs
March 14, 2026 at 7:16 pmcheck jewelcrest outlet – Stumbled on this site randomly; the marketplace seems updated and busy.
JamesShubs
March 14, 2026 at 7:19 pmexplore ivory brook – After checking the page briefly, the merchandise appears quite interesting.
JonathanShubs
March 14, 2026 at 7:42 pmbrowse dawnstone treasures – Easy-to-use layout, pages load fast and marketplace feels welcoming.
KennethShubs
March 14, 2026 at 7:43 pmvisit autumn cove – Loved the charming bazaar vibe that makes shopping feel comfortable.
RobertNal
March 14, 2026 at 7:55 pmВсе о строительстве https://mia.km.ua и ремонте на одном сайте. Полезные советы по выбору строительных материалов, технологиям строительства, отделке помещений и дизайну интерьера. Практические рекомендации для тех, кто строит дом или делает ремонт.
AndrewCit
March 14, 2026 at 7:55 pmОнлайн журнал https://mts-agro.com.ua о садоводстве и дизайне участка. Советы по выращиванию растений, уходу за садом, ландшафтному дизайну и обустройству дачного участка. Идеи для сада, рекомендации по посадке цветов, деревьев и созданию красивого и уютного пространства.
Archiestync
March 14, 2026 at 7:57 pmНовостной портал https://sevsovet.com.ua с актуальными новостями Украины и мира. Политика, экономика, общество, технологии и культура. Оперативные новости и аналитические материалы.
Williezosse
March 14, 2026 at 7:57 pmЖенский портал https://socvirus.com.ua о моде, красоте и здоровье. Полезные советы по уходу за собой, психология отношений, идеи стиля и рекомендации по здоровому образу жизни.
TimothyShubs
March 14, 2026 at 8:02 pmsee boutique offerings – The pages load quickly and navigating the products feels smooth.
EdwardShubs
March 14, 2026 at 8:14 pmshop chestnutharbor finds – The marketplace layout is organized, and browsing feels smooth and easy.
Williamglilm
March 14, 2026 at 8:16 pmФитнес-портал https://sportinvent.com.ua о тренировках, здоровом образе жизни и правильном питании. Программы тренировок, советы тренеров, упражнения для дома и зала, рекомендации по похудению и набору мышечной массы. Узнайте, как улучшить физическую форму и поддерживать здоровье.
MichaelShubs
March 14, 2026 at 8:29 pmonline outlet store – I took a short look and the navigation seems clear and responsive.
LarryShubs
March 14, 2026 at 8:43 pmdriftbrookoutlet – Good outlet style site navigation clear and easy browsing.
GeorgeShubs
March 14, 2026 at 8:44 pmemporium gems – The website layout is tidy, smooth, and user-friendly.
JeffreyShubs
March 14, 2026 at 8:54 pmsee depot exchange hub – Went through the site and the platform appears well-structured and trustworthy.
JeffreyShubs
March 14, 2026 at 9:15 pmview vendor items – The marketplace interface is clear and exploring sections feels easy.
GregoryShubs
March 14, 2026 at 9:17 pmchestnutstonebazaar – Browsing this bazaar felt easy and enjoyable, with clear sections and info.
Williamjully
March 14, 2026 at 9:36 pmХотите быстро развить канал на Rutube? Накрутка подписчиков Rutube поможет увеличить аудиторию, повысить доверие к каналу и ускорить продвижение видео. Перейдя по запросу [url=https://kwork.ru/smm/47195414/prosmotry-rutub-video-bez-spisaniy-s-garantiey]как увеличить просмотры видео на rutube[/url] вы получите живых подписчиков, плавное добавление и безопасные методы продвижения. Отличное решение для новых и развивающихся каналов, которым важно быстрее набрать активность и привлечь больше просмотров. Начните рост канала уже сегодня.
DavidShubs
March 14, 2026 at 9:39 pmbrowse this shop – I landed on this page by chance and the layout looks simple and organized.
ScottShubs
March 14, 2026 at 9:45 pmbrowse driftorchard deals – Organized marketplace layout, navigation smooth and enjoyable.
PeterShubs
March 14, 2026 at 10:20 pmcloudcove finds – Browsing is comfortable, with responsive pages and a stylish boutique feel.
JacobShubs
March 14, 2026 at 10:27 pmexplore foreststone treasures – Browsing items is relaxing and the layout feels organized.
GaryShubs
March 14, 2026 at 10:31 pmcheck vendor hub here – Found this site today, seems like a good place to explore products.
FrankShubs
March 14, 2026 at 10:31 pmorchardstone store link – Nice browsing experience so far, sections look structured.
RobertShubs
March 14, 2026 at 10:52 pmjasperstoneemporium – Interesting emporium style shop, products seem nicely displayed.
JamesShubs
March 14, 2026 at 11:05 pmvisit pearlbrook – Had a quick look here, the layout seems clean and organized.
FrankShubs
March 14, 2026 at 11:25 pmvisit cloudstone emporium – Browsing sections today was easy, with a neat and intuitive design.
DavidShubs
March 14, 2026 at 11:35 pmretail boutique page – Well-structured site, exploring items is simple and enjoyable.
NicholasShubs
March 14, 2026 at 11:40 pmlook at bazaar treasures – Exploring items was smooth and the layout feels lively.
JamesShubs
March 14, 2026 at 11:43 pmorchardhub – Pages are neat, exploring the catalog is smooth and quick.
JamesShubs
March 15, 2026 at 12:01 amshopvault – Browsing feels quick, interface is clean and organized.
JohnShubs
March 15, 2026 at 12:03 ammarketplace page – Came across this site earlier and it looks clean and easy to browse.
Darrenevome
March 15, 2026 at 12:04 amСтатьи о маркетинге https://reklamspilka.org.ua PR и рекламе для бизнеса и специалистов. Практические рекомендации по продвижению брендов, управлению репутацией, контент-стратегии, рекламе в интернете и эффективным коммуникациям с клиентами.
JoseShubs
March 15, 2026 at 12:04 amjuniper vendor marketplace – Quick visit revealed a tidy collection of products worth exploring.
AlfonsoGal
March 15, 2026 at 12:05 amСайт новостей https://vestionline.com.ua Украины и мира с ежедневными обновлениями. Политика, экономика, общество, технологии и культура. Узнавайте последние события и следите за новостями.
Stevenownew
March 15, 2026 at 12:05 amМастерская креативных идей https://rusproekt.org изготовление авторской мебели и текстиля, создание уникального декора и фитодизайна. Отделочные работы в стиле кантри и прованс, оформление интерьеров и индивидуальные дизайнерские решения для дома, кафе и загородных пространств.
Thomassob
March 15, 2026 at 12:08 amЖенский интернет-портал https://ledis.top о красоте, здоровье, моде и стиле жизни. Советы по уходу за собой, психология отношений, рецепты и полезные статьи для современной женщины.
AubreyTub
March 15, 2026 at 12:09 amСвежие новости https://zoobonus.com.ua Украины и мира в одном месте. Политика, экономика, общество, технологии, культура и происшествия. Актуальные события и аналитические материалы.
DavidShubs
March 15, 2026 at 12:11 amonline emporium visit – Spent a minute browsing and the layout seems well planned.
HenryShubs
March 15, 2026 at 12:30 amdiscover cloverbrook treasures – Browsing today was smooth, with an organized layout and user-friendly pages.
JohnShubs
March 15, 2026 at 12:39 ammarketplace homepage – Items are clearly displayed, and browsing sections feels easy.
DavidShubs
March 15, 2026 at 12:49 amorchardmarketfinds – Products are clearly arranged, navigation is fast and intuitive.
JonathanShubs
March 15, 2026 at 12:51 amview frost summit selections – Browsing the platform is effortless and navigation is quick.
DavidShubs
March 15, 2026 at 1:04 amboutiquecorner – Items are displayed clearly, browsing the catalog is smooth.
WilliamShubs
March 15, 2026 at 1:10 amjewel ridge emporium – The layout looks pleasant and the store feels quite friendly overall.
JohnShubs
March 15, 2026 at 1:17 ambrowse pebblepine – The store setup makes it simple to check out different items.
CarlShubs
March 15, 2026 at 1:35 amdiscover clovercrest treasures – Marketplace feels tidy and accessible, making exploring vendors simple and pleasant.
FrankShubs
March 15, 2026 at 1:41 amkettle brook listings online – Browsed the platform this evening, everything feels clean and user-friendly.
ChristopherShubs
March 15, 2026 at 1:43 ammarketplace portal – Well-structured and inviting, exploring items online is enjoyable.
JohnShubs
March 15, 2026 at 1:55 ambrookbazaar – Pages are clean, and finding items is straightforward.
LarryShubs
March 15, 2026 at 2:04 amdiscover market selections – The marketplace feels organized and navigating listings was easy.
JohnShubs
March 15, 2026 at 2:07 ambrookhub – Pages are tidy, exploring the catalog is quick and simple.
RichardShubs
March 15, 2026 at 2:21 amthis outlet shop – The site design makes exploring the store pretty straightforward.
ThomasShubs
March 15, 2026 at 2:23 ampebblestonebazaar – Came across this bazaar online, the items seem arranged neatly and clearly.
DanielShubs
March 15, 2026 at 2:46 ammarket deals page – Clear interface, browsing categories and products feels effortless.
RichardShubs
March 15, 2026 at 3:00 amsagegallery – Layout is tidy, making browsing through the outlet simple.
RichardShubs
March 15, 2026 at 3:08 amoutlettrailfinds – Items are neatly arranged, navigation feels smooth.
EricShubs
March 15, 2026 at 3:17 amvisit kettle marketplace hub – Found valuable content while checking out the marketplace today.
JustinShubs
March 15, 2026 at 3:18 amlook at garnet harbor deals – Navigating the marketplace feels effortless and pleasant.
ChristopherShubs
March 15, 2026 at 3:29 amvisit pine harbor – Took a glance at the shop, pages load and flow smoothly.
JosephShubs
March 15, 2026 at 3:30 amboutique store page – Everything appears neatly arranged which makes browsing enjoyable.
AnthonyShubs
March 15, 2026 at 3:48 amretail orchard page – Clean design, products are easy to locate and view.
CharlesShubs
March 15, 2026 at 4:05 amcovetreasures – Pages are well structured, browsing items feels seamless.
JosephShubs
March 15, 2026 at 4:09 amharbortreasures – Pages are clearly structured, finding items is straightforward.
DanielShubs
March 15, 2026 at 4:35 ampinestone marketplace – Items appear displayed clearly throughout the shop.
ThomasShubs
March 15, 2026 at 4:36 amshop homepage – Came across this page today and it looks like it could be worth exploring.
PatrickShubs
March 15, 2026 at 4:47 amexplore lantern brook hub – A brief visit shows the marketplace is neat and reliable.
PaulShubs
March 15, 2026 at 4:51 amofficial emporium link – Tidy layout, finding items feels quick and comfortable.
ChristopherShubs
March 15, 2026 at 5:10 amstonetreasures – Pages are structured, finding items feels straightforward.
ChristopherShubs
March 15, 2026 at 5:11 amstoneemporium – Items are easy to locate, layout is clean and organized.
MatthewShubs
March 15, 2026 at 5:43 amvisit plumbrook – Just checked this shop, the market layout looks clean.
CharlesShubs
March 15, 2026 at 5:45 amvisit this outlet – The design feels user-friendly and sections are easy to explore.
StevenShubs
March 15, 2026 at 5:55 amproduct emporium hub – Smooth navigation, items are well organized.
MatthewShubs
March 15, 2026 at 6:13 amcovevault – Sections are structured clearly, browsing pages feels effortless.
MatthewShubs
March 15, 2026 at 6:14 amgrovehub – Pages are clean and organized, exploring the catalog is fast.
JustinShubs
March 15, 2026 at 6:21 amlantern vendor marketplace – Browsed the pages quickly, interface is clean and content is clear.
MarkShubs
March 15, 2026 at 6:50 amstylevault – Attractive design with easy-to-follow links for all products.
ChristopherShubs
March 15, 2026 at 6:53 ammarketplace page – Browsing feels easy thanks to the tidy arrangement of items.
KennethShubs
March 15, 2026 at 6:59 amoutlet homepage – Attractive site design, exploring products is smooth.
DonaldShubs
March 15, 2026 at 7:17 amstonefinds – Items are neatly arranged, navigating the site feels effortless.
DonaldShubs
March 15, 2026 at 7:18 ambazaarvault – Items are easy to explore, pages feel organized and user-friendly.
StevenShubs
March 15, 2026 at 7:57 amorchardhub – Products are easy to locate, interface is clean and responsive.
KevinShubs
March 15, 2026 at 8:02 amproduct outlet hub – User-friendly layout, finding items is straightforward.
DanielShubs
March 15, 2026 at 8:04 amlanternstonebazaar – Interesting bazaar concept, enjoyed looking through a few products.
PaulShubs
March 15, 2026 at 8:21 amemporiumfinds – Items are displayed clearly, moving through pages is simple.
PaulShubs
March 15, 2026 at 8:23 amsilvervault – Interface is intuitive, navigating between sections feels natural.
KevinShubs
March 15, 2026 at 9:06 amstonehub – Clean design with intuitive navigation, products stand out nicely.
Michaeldiuch
March 15, 2026 at 9:06 amСпортивный журнал https://beachsoccer.com.ua о мире спорта. Новости спортивных событий, обзоры матчей, аналитика соревнований и интервью со спортсменами. Читайте актуальные статьи о футболе, хоккее, теннисе, боксе и других популярных видах спорта.
CharlesKebra
March 15, 2026 at 9:08 amЖурнал о строительстве https://bms-soft.com.ua и ремонте для дома и квартиры. Полезные статьи о строительных технологиях, отделке помещений, выборе материалов и ремонте. Советы специалистов, идеи для интерьера и практические рекомендации.
EdwardShubs
March 15, 2026 at 9:08 ammarket browse – Well-structured design, finding products is simple and quick.
Jamesalorn
March 15, 2026 at 9:08 amЧайный портал https://etea.com.ua для любителей чая. Статьи о разных сортах чая, традициях чаепития, способах заваривания и пользе чая для здоровья. Узнайте больше о культуре чая, популярных напитках и интересных фактах о чае.
Geraldwek
March 15, 2026 at 9:08 amПортал о здоровье глаз https://eyecenter.com.ua и зрении человека. Советы по профилактике заболеваний глаз, улучшению зрения, правильной работе за компьютером и уходу за глазами. Полезные статьи о здоровье глаз и современных методах коррекции зрения.
Jesushox
March 15, 2026 at 9:09 amПортал о технологиях https://helikon.com.ua и инновациях: новости IT, обзоры гаджетов, смартфонов и компьютеров. Статьи о цифровых сервисах, искусственном интеллекте и технологических трендах.
MatthewShubs
March 15, 2026 at 9:15 amstorefront market – Navigation feels smooth and the layout is tidy and simple.
AndrewShubs
March 15, 2026 at 9:25 amemporiumlane – Interface is organized, moving through products feels smooth.
AndrewShubs
March 15, 2026 at 9:28 amcovefinds – Explored the boutique, items are neatly displayed and easy to browse.
TracySig
March 15, 2026 at 9:39 amда да да привет привт
JasonShubs
March 15, 2026 at 10:15 amnightstoneemporium – Really like the design here, products are displayed clearly and neatly.
EdwardShubs
March 15, 2026 at 10:16 amharborfinds – Browsed the bazaar today, catalog was easy to navigate.
AnthonyShubs
March 15, 2026 at 10:24 amthis outlet site – Moving around the pages is simple and the layout is organized.
JoshuaShubs
March 15, 2026 at 10:28 amvelvetcollections – Interface is intuitive, finding items online is effortless.
JoshuaShubs
March 15, 2026 at 10:33 amharborhub – Pages are neat, exploring the catalog is fast and easy.
Donaldjep
March 15, 2026 at 10:49 amghbdtn привет
RyanShubs
March 15, 2026 at 11:23 amoakcove shop portal – Clean and elegant site, products are simple to browse and explore.
JasonShubs
March 15, 2026 at 11:24 amridgefinds – Browsed the emporium today, the interface is clear and easy to use.
BrianShubs
March 15, 2026 at 11:28 amvelvetmarket – Items are clearly displayed, site navigation is quick and easy.
MarkShubs
March 15, 2026 at 11:31 ammarket shop page – Fun name, tidy layout, and moving through items felt effortless.
KevinShubs
March 15, 2026 at 11:35 amskyhub – Layout feels clean, navigating through products is smooth and effortless.
RupertKnort
March 15, 2026 at 11:52 amМужской портал https://hooligans.org.ua о стиле жизни, здоровье, карьере и саморазвитии. Статьи о спорте, отношениях, финансах, технологиях и мужских интересах. Полезные советы, лайфхаки и вдохновение для современных мужчин.
DanielinHah
March 15, 2026 at 11:53 amЖенский портал https://psilocybe-larvae.com о красоте, здоровье, отношениях и саморазвитии. Полезные советы для женщин, идеи для дома и семьи, мода, психология, рецепты, лайфхаки и вдохновение на каждый день. Читайте статьи, находите полезную информацию и улучшайте свою жизнь.
Michaelkiz
March 15, 2026 at 11:54 amИнформационный автожурнал https://real-voice.info о мире автомобилей. Новости автопрома, обзоры новых моделей, тест-драйвы, сравнения машин, советы по эксплуатации и обслуживанию. Полезные материалы для автолюбителей, владельцев авто и тех, кто выбирает автомобиль.
EugeneMOF
March 15, 2026 at 12:00 pmmontenegro car rentals car hire in montenegro
Williamdup
March 15, 2026 at 12:04 pmнужен биг бэг? https://big-bag-mkr.ru: прочные биг-бэги для стройматериалов, зерна, гранулята и других сыпучих продуктов. Производство под заказ и со склада, консультация, расчет, доставка по РФ.
Lowelltum
March 15, 2026 at 12:28 pmНакрутка подписчиков Rutube поможет быстро увеличить аудиторию канала и повысить доверие к контенту. Живые подписчики создают активность, улучшают видимость роликов и привлекают новых зрителей. Перейдя по запросу [url=https://kwork.ru/smm/45269880/zhivie-podpischiki-v-rutub-kanal-bez-spisaniy-bez-botov]накрутка подписчиков рутуб купить[/url] вы получите быстрый старт канала, безопасные методы продвижения и стабильный рост аудитории без отписок. Отличное решение для тех, кто хочет быстрее развить канал на Rutube.
EdwardShubs
March 15, 2026 at 12:32 pmvioletshop – Pages load quickly, finding products is simple and easy.
GaryShubs
March 15, 2026 at 12:33 pmoakstone browsing – Nice marketplace feel, items are neatly presented.
JeffreyShubs
March 15, 2026 at 12:34 pmoutletfinds – Products are well arranged, navigating the site is intuitive.
EdwardShubs
March 15, 2026 at 12:40 pmoutletcorner – Products are clearly displayed, browsing the catalog is smooth.
PaulShubs
March 15, 2026 at 12:41 pmbazaar marketplace – I’m looking through the catalog and the selection seems quite good.
TimothyShubs
March 15, 2026 at 1:35 pmoutletviolet – Items are easy to browse, catalog sections feel organized.
EricShubs
March 15, 2026 at 1:37 pmolivebrook portal – Easy-to-use market site, checking different sections is simple.
RyanShubs
March 15, 2026 at 1:37 pmoutletlane – Layout is neat and organized, navigating through products is easy.
TimothyShubs
March 15, 2026 at 1:48 pmcovefinds – Browsed the emporium today, items are well arranged and easy to explore.
StevenShubs
March 15, 2026 at 1:50 pmlinen cove emporium – Browsed the store briefly and the organization looks quite thoughtful.
GeorgeExpen
March 15, 2026 at 1:51 pmМы собрали https://kinogo-film.my для вас не просто фильмы и сериалы, а целые миры. От классики, которая трогает душу, до свежих блокбастеров. Здесь есть место для вечернего романтического кино под пледиком, для боевика, который вы ждали весь год. Онлайн-кинотеатр Киного — это место, где вы сами решаете, какой будет ваш киносеанс.
JeffreyShubs
March 15, 2026 at 2:37 pmcovecollectionshop – Clean layout, browsing products is very easy.
LarryShubs
March 15, 2026 at 2:40 pmolive orchard items – Pleasant layout, browsing different sections is easy and intuitive.
JacobShubs
March 15, 2026 at 2:41 pmravenmarket – Items are clearly displayed, moving between sections is intuitive.
JeffreyShubs
March 15, 2026 at 2:55 pmorchardfindsplus – Organized catalog and clear layout make exploring products effortless.
AndrewShubs
March 15, 2026 at 2:57 pmretail emporium page – The shop sections respond quickly and the layout is easy to follow.
Jerryped
March 15, 2026 at 3:20 pmJustin TV Azerbaijan https://justin-tv.com.az main page: live match watch, football, big matches, basketball, UFC and game schedule sections.
Erickcrype
March 15, 2026 at 3:23 pmLamine Yamal https://www.lamine-yamal.com.az Barcelona career, statistics, age, where he is from and basic biographical facts. Lamine Yamal profile on one page.
nedvizhkavspb 301
March 15, 2026 at 3:25 pmПродажа квартир https://nedvizhkavspb.ru в Санкт-Петербурге. Большой выбор недвижимости на первичном и вторичном рынке: студии, однокомнатные, двухкомнатные и просторные квартиры в разных районах города. Актуальные предложения, удобный поиск и помощь в покупке жилья.
kvartira778 96
March 15, 2026 at 3:25 pmПродажа квартир https://kvartira778.ru в Санкт-Петербурге от собственников и агентств недвижимости. Актуальные объявления о продаже квартир в новостройках и на вторичном рынке.
JacobShubs
March 15, 2026 at 3:39 pmstonecorner – Marketplace feels tidy, navigation is straightforward.
JustinShubs
March 15, 2026 at 3:45 pmopalbrook selections – Well-arranged pages, exploring products feels comfortable.
EricShubs
March 15, 2026 at 3:47 pmbrooktreasures – Pages are organized and simple to navigate.
JacobShubs
March 15, 2026 at 4:00 pmstonegallery – Items are easy to spot, pages feel neat and welcoming.
KennethShubs
March 15, 2026 at 4:06 pmexplore the market – The layout is clean and product listings look inviting.
NicholasShubs
March 15, 2026 at 4:40 pmwavecollection – Marketplace flows nicely, exploring items is straightforward.
BenjaminShubs
March 15, 2026 at 4:51 pmopalriver deals – Simple design, exploring the catalog is quick and intuitive.
AndrewShubs
March 15, 2026 at 4:52 pmrivergallery – Products are presented neatly, navigation is smooth and easy.
NicholasShubs
March 15, 2026 at 5:07 pmstonegallery – Layout is tidy, making browsing the market simple.
JoshuaShubs
March 15, 2026 at 5:17 pmshopping boutique link – The boutique has a pleasant design and items are easy to browse.
JonathanShubs
March 15, 2026 at 5:42 pmwavestonefindshop – Emporium pages look tidy, browsing products feels natural.
GregoryShubs
March 15, 2026 at 5:56 pmthis outlet shop – Found this outlet online, the pages seem organized nicely.
JoshuaShubs
March 15, 2026 at 5:57 pmstonefinds – Browsed the bazaar today, items are neatly arranged and simple to explore.
JonathanShubs
March 15, 2026 at 6:12 pmharborfindsplus – Organized catalog and clear layout make exploring products effortless.
LarryShubs
March 15, 2026 at 6:43 pmbrookfinds – Layout is tidy, exploring products online feels natural.
FrankShubs
March 15, 2026 at 7:01 pmcheck this emporium – The site layout makes it simple to look through items.
BenjaminShubs
March 15, 2026 at 7:03 pmroselane – Products are easy to find, layout is clean and welcoming.
JamesShubs
March 15, 2026 at 7:13 pmbrowse Wild Orchard vendors – Found this marketplace while looking for unique online stores.
JustinShubs
March 15, 2026 at 7:18 pmcovetreasures – Pages are structured well, exploring products is straightforward.
JamesShubs
March 15, 2026 at 7:26 pmbayridgevendorstudio – Stumbled upon this platform today, looks like a creative space for vendors.
ScottShubs
March 15, 2026 at 7:45 pmcoveemporiumshop – Layout is tidy, navigating items is quick and smooth.
Chrisgip
March 15, 2026 at 7:51 pmПродвигайте свой аккаунт быстрее с помощью накрутки подписчиков в TikTok. Перейдя по запросу [url=https://kwork.ru/smm/45268325/zhivie-podpischiki-v-tiktok-kanal-bez-spisaniy-bez-botov]подписчики в реальном времени tiktok Кворк[/url] вы сможете увеличить количество фолловеров, повысить доверие к профилю и привлечь больше просмотров и лайков. Быстрая и безопасная накрутка поможет вашему контенту попасть в рекомендации и ускорить рост аккаунта. Подходит для блогеров, брендов и бизнеса, которые хотят развиваться в TikTok и получать больше охватов.
JamesShubs
March 15, 2026 at 7:55 pmclovervendorcollective – Nice collective concept here, browsing around felt smooth today.
JonathanShubs
March 15, 2026 at 8:09 pmcovetreasure – Pages feel well-arranged, browsing the boutique is effortless.
BrandonShubs
March 15, 2026 at 8:24 pmemporiumstonefinds – Items are neatly arranged, navigating feels natural.
JamesShubs
March 15, 2026 at 8:29 pmBayridge marketplace hub – Just found this platform, seems like a creative and active vendor space.
DavidShubs
March 15, 2026 at 8:51 pmwildstonebazaar – Seems like a unique marketplace filled with interesting items.
DavidShubs
March 15, 2026 at 9:04 pmCoastridge online studio – Smooth browsing experience with clean pages, exploring feels easy.
JeffreyShubs
March 16, 2026 at 12:01 pmNovelNest – Enjoyable browsing experience, hoping this project attracts more users.
EdwardShubs
March 16, 2026 at 12:04 pmopen raincrest vendor platform – Browsing around felt quick and well organized.
RyanShubs
March 16, 2026 at 12:27 pmlinen harbor studio portal – Smooth transitions and fast page load create a pleasant browsing experience.
GaryShubs
March 16, 2026 at 12:27 pmChestnut online marketplace – Catchy name paired with straightforward design, navigation is easy.
BrianShubs
March 16, 2026 at 12:43 pmAlpine vendor network – The name implies a community-driven shop.
JacobShubs
March 16, 2026 at 1:09 pmCraftedCollective – Straightforward navigation, makes browsing products simple and easy.
RonaldShubs
March 16, 2026 at 1:19 pmexplore rain vendor market – Everything appears neatly arranged, making it easy to find what you need.
GaryShubs
March 16, 2026 at 1:33 pmexplore linen vendor – Clear layout and intuitive navigation make browsing quick and effortless.
NicholasShubs
March 16, 2026 at 1:33 pmcheck out Chestnut Vendor Emporium – Growing marketplace with potential, wishing them well.
NicholasShubs
March 16, 2026 at 2:18 pmCreativeCorner – Intuitive pages with a creative feel, makes checking out vendors easy.
EdwardShubs
March 16, 2026 at 2:18 pmvendor studio site – Came across this page today and it sparked my curiosity.
TimothyShubs
March 16, 2026 at 2:36 pmravensage online vendor place – Browsing listings today felt smooth and intuitive.
StephenShubs
March 16, 2026 at 2:39 pmcloudbrookvendorhub – Pleasant browsing experience here, everything loads smoothly today.
EricShubs
March 16, 2026 at 2:40 pmmaple marketplace hub – Easy-to-follow navigation with neatly arranged content throughout.
remont-vannoy 28
March 16, 2026 at 3:25 pmремонт ванных комнат в спб ремонт ванна ключ цена
StephenShubs
March 16, 2026 at 3:27 pmTreasureCrate – Clear layout and smooth browsing, great for first-time visitors.
JustinShubs
March 16, 2026 at 3:43 pmbrowse Cloud Vendor Collective – Looks like a collaborative marketplace, I’ll revisit soon.
LarryShubs
March 16, 2026 at 3:43 pmmaple supply portal – Organized design and smooth transitions between pages.
JeffreyShubs
March 16, 2026 at 3:49 pmraven vendor center – Moving across sections felt effortless and clear.
TimothyShubs
March 16, 2026 at 3:51 pmvendor collective site – The name has a nice ring and feels well thought out.
JustinShubs
March 16, 2026 at 4:37 pmCurioCrate – Simple, well-organized hub, I enjoyed checking out the listings.
BrandonShubs
March 16, 2026 at 4:49 pmCloverbrook marketplace – Smooth and responsive, navigating the hub feels effortless.
JustinShubs
March 16, 2026 at 4:49 pmvendor place marblecrest – Well-organized layout with smooth page transitions and clear sections.
JeffreyShubs
March 16, 2026 at 5:24 pmApricot shop collective – Exploring unique vendor houses online is a lot of fun.
BrandonShubs
March 16, 2026 at 5:47 pmMarketSphere – Simple interface, all sections load quickly and clearly.
BenjaminShubs
March 16, 2026 at 5:54 pmcollective corner marble – Organized interface and intuitive navigation make browsing effortless.
JacobShubs
March 16, 2026 at 6:56 pmsee the Apricot marketplace – This emporium sounds charming and worth checking out.
AltonScuch
March 16, 2026 at 7:04 pmБесплатная консультация юриста по расторжению брака поможет разобраться в ваших правах и возможностях при разводе. Специалист объяснит порядок развода через суд или ЗАГС, подскажет, как решаются вопросы раздела имущества, алиментов и проживания детей. Перейдя по запросу [url=https://www.pravovik24.ru/konsultatsii/yurist-po-razvodam/]консультация юриста по разводу онлайн бесплатно[/url] вы получите профессиональные рекомендации и ответы на все вопросы, чтобы пройти процедуру развода максимально спокойно и с защитой ваших интересов.
JamesShubs
March 16, 2026 at 7:16 pmsimple marketplace link – Just discovered this page and it looks easy to browse.
JustinShubs
March 16, 2026 at 8:07 pmvendor workshop page – Spent a few minutes browsing, everything seems straightforward and user-friendly.
NicholasShubs
March 16, 2026 at 8:26 pmcheck this vendor hub – Stumbled upon this site while searching for interesting shops.
DavidShubs
March 16, 2026 at 8:28 pmthis vendor resource – Browsed through a couple sections and it seems useful.
JustinShubs
March 16, 2026 at 9:10 pmwildvendorworkshop.shop – Just took a quick look, navigation seems smooth and simple.
JohnShubs
March 16, 2026 at 9:41 pmthis vendor marketplace – Browsed around briefly and the navigation feels pretty smooth.
Michaelmuddy
March 16, 2026 at 9:56 pmда да да привет привт
JonathanShubs
March 16, 2026 at 9:58 pmsee Aurora vendor hub – Collaborative marketplaces online offer lots of unique finds.
JacobShubs
March 16, 2026 at 10:06 pmriverstone vendor marketplace hub – Everything is placed neatly, making navigation effortless.
JustinShubs
March 16, 2026 at 10:13 pmvendor workshop page – Spent a few minutes browsing, everything seems straightforward and user-friendly.
RichardShubs
March 16, 2026 at 10:54 pmmarketplace link here – Stumbled upon this earlier and the content seems pretty solid.
JustinShubs
March 16, 2026 at 11:13 pmbrowse the vendor workshop – Took a short look, navigation is simple and pages are easy to follow.
NicholasShubs
March 16, 2026 at 11:20 pmopen river vendor marketplace – Exploring the site today felt smooth and simple.
LarryShubs
March 16, 2026 at 11:29 pmexplore Autumn crate shop – Fun and catchy name that invites me to browse the products.
CharlesShubs
March 17, 2026 at 12:06 amvendor marketplace here – Looked through it quickly and everything appears to load smoothly.
JustinShubs
March 17, 2026 at 12:14 amvendor directory link – Just skimmed, navigation feels intuitive and layout is clear.
JonathanShubs
March 17, 2026 at 12:35 ambrowse rosebrook vendor products – The platform design allows browsing items quickly and easily.
JustinShubs
March 17, 2026 at 1:06 amAutumn Willow shop hub – A gentle and inviting title for a vendor house online.
ChristopherShubs
March 17, 2026 at 1:17 amvisit silk vendor workshop – Just discovered this page and it seems pretty well organized.
JustinShubs
March 17, 2026 at 1:18 amvendor hub portal – Opened briefly, layout seems simple and practical.
ScottShubs
March 17, 2026 at 1:50 amrose vendor storefront – The site feels organized, keeping browsing relaxed.
JustinShubs
March 17, 2026 at 2:19 amvendor directory link – Just skimmed, navigation feels intuitive and layout is clear.
MatthewShubs
March 17, 2026 at 2:28 amexplore this vendor hub – Came across this platform and it looks like a valuable resource.
BrandonShubs
March 17, 2026 at 3:05 amrubyridge vendor showcase – Browsing through the site was quick, smooth, and intuitive.
JustinShubs
March 17, 2026 at 3:19 amwildvendorworkshop.shop – Just took a quick look, navigation seems smooth and simple.
MarkShubs
March 17, 2026 at 3:39 amonline vendor hub – Browsed a few sections, layout feels clean and organized.
JustinShubs
March 17, 2026 at 4:19 amsee this vendor site – Looked briefly, content appears clear and well organized.
SamuelShubs
March 17, 2026 at 4:21 amruby vendor marketplace hub – Everything is clearly placed, making navigation simple.
StevenShubs
March 17, 2026 at 5:00 amrecommended vendor page – Took a short look, the layout appears straightforward.
JustinShubs
March 17, 2026 at 5:20 amquick vendor portal – Took a quick glance, pages are tidy and content is easy to follow.
AndrewShubs
March 17, 2026 at 6:17 amquick vendor site – Browsed for a bit, layout looks tidy and user-friendly.
JustinShubs
March 17, 2026 at 6:20 amhelpful vendor page – Checked quickly, navigation is smooth and pages are well organized.
JustinShubs
March 17, 2026 at 7:21 amhelpful vendor page – Checked quickly, navigation is smooth and pages are well organized.
KennethShubs
March 17, 2026 at 7:29 amvendor marketplace link – Opened quickly, structure is clear and the information is simple to understand.
JustinShubs
March 17, 2026 at 8:23 amvendor directory link – Just skimmed, navigation feels intuitive and layout is clear.
BrianShubs
March 17, 2026 at 8:43 amthis vendor place – Took a quick look, layout is straightforward and user-friendly.
JustinShubs
March 17, 2026 at 9:26 amvendor marketplace link – Took a glance, layout appears clean and content is readable.
TimothyShubs
March 17, 2026 at 9:55 amexplore this vendor collective – Took a short look, platform seems practical and easy to navigate.
JustinShubs
March 17, 2026 at 10:28 amvisit wild vendor workshop – Browsed briefly, content appears organized and easy to read.
JasonShubs
March 17, 2026 at 11:09 amrecommended vendor page – Took a glance, the platform seems tidy and easy to browse.
JustinShubs
March 17, 2026 at 11:30 amvendor platform link – Quick visit shows a clean layout and clear content.
RyanShubs
March 17, 2026 at 12:21 pmvendor directory link – Took a glance, site seems easy to use and content is informative.
LarryRette
March 17, 2026 at 12:28 pmЮридическая консультация по разделу имущества поможет защитить ваши права и избежать ошибок при разводе или спорах между собственниками. Переходите по запросу [url=https://www.pravovik24.ru/konsultatsii/yurist-po-razdelu-imushchestva/]лучший адвокат по разделу имущества[/url] – юрист оценит ситуацию, разъяснит перспективы дела, подскажет, как правильно оформить документы и выстроить стратегию. Вы получите чёткий план действий и поддержку на каждом этапе — от переговоров до суда.
JustinShubs
March 17, 2026 at 12:32 pmcheck out this vendor hub – Quick glance shows a neat structure and practical information.
JustinShubs
March 17, 2026 at 1:37 pmsimple vendor site – Spent a moment browsing, everything seems easy to navigate and neat.
GaryShubs
March 17, 2026 at 1:37 pmsee this vendor hub – Checked quickly, everything appears structured and easy to comprehend.
Dennytum
March 17, 2026 at 2:19 pmХочешь казино бонус? https://t.me/s/casino_bonus_bezdep/25 всегда актуальные бонусы в онлайн казино. Получайте бонусы без вложений, фриспины и подарки за регистрацию. Актуальные предложения, честные условия отыгрыша и список проверенных казино с бонусами без депозита.
JustinShubs
March 17, 2026 at 2:41 pmrecommended vendor page – Opened quickly, pages feel organized and user-friendly.
MichaelShubs
March 17, 2026 at 2:44 pmsee product listings – The structure is intuitive, making it easy to look around.
EricShubs
March 17, 2026 at 2:46 pmhelpful vendor page – Spent a few moments browsing, content is clear and navigation feels smooth.
Geraldfah
March 17, 2026 at 3:31 pmЧитать больше на сайте: https://slovarsbor.ru/c/3-%D0%BE%D0%BB/
JustinShubs
March 17, 2026 at 3:43 pmvendor directory link – Just skimmed, navigation feels intuitive and layout is clear.
JamesShubs
March 17, 2026 at 3:50 pmvendor marketplace link – It brings together different sellers, which adds to the appeal.
LarryShubs
March 17, 2026 at 4:00 pmsimple vendor site – Browsed quickly, everything feels organized, clean, and easy to read.
JohnShubs
March 17, 2026 at 4:58 pmcheck out vendor deals – The site looks professional, making product discovery smooth.
SamuelShubs
March 17, 2026 at 5:14 pmsee this vendor hub – Opened briefly, everything seems structured and practical.
DanielLet
March 17, 2026 at 5:21 pmЛучшие казино рейтинг онлайн казино: актуальный список онлайн казино с высоким рейтингом, быстрым выводом средств и выгодными бонусами. Обзор лицензий, игр и платежных методов поможет выбрать надежное казино для комфортной игры.
BryanFix
March 17, 2026 at 5:22 pmХалява казино рейтинг казино с бонусами за регистрацию: фриспины за регистрацию, бонусы без пополнения и акции для новых игроков. Сравнивайте условия отыгрыша, выбирайте проверенные онлайн казино и начинайте играть бесплатно с возможностью вывода выигрыша.
Michaelcom
March 17, 2026 at 5:31 pmЛучшие фриспины 2026 https://nodepositcasinobonuscodes.ru: бесплатные вращения в онлайн казино без вложений. Подборка проверенных сайтов, бонусы за регистрацию, честные условия отыгрыша и возможность вывода выигрыша без риска для игроков.
Stevenhaush
March 17, 2026 at 5:40 pmОфициальный сайт покерок сайт: регистрация, вход, бонусы и игра в онлайн покер. Обзор возможностей, турниров, кеш-столов и мобильного приложения. Узнайте, как начать играть и выводить деньги на проверенной платформе.
RichardShubs
March 17, 2026 at 6:09 pmbrowse vendor listings – Finding items was quick, thanks to the organized layout.
SamuelShubs
March 17, 2026 at 6:28 pmrecommended vendor page – Browsed quickly, everything appears structured and user-friendly.
JosephShubs
March 17, 2026 at 7:17 pmbrowse shop listings – It’s visually tidy, and scanning through products is comfortable.
Scottstolo
March 17, 2026 at 7:39 pmUse this visit this site to decode any vehicle identification number and get full specifications instantly.
Jasonsnorn
March 17, 2026 at 7:43 pmFree check here reveals critical information about vehicle past that sellers might hide.
Alvinteece
March 17, 2026 at 8:00 pmSmart travelers private jet charter fly book charter jets to skip airport lines and fly on their own schedule.
Jamesrab
March 17, 2026 at 8:14 pmGet accurate http://www.rentprivatejetfly.com/ private jet cost estimates that include all fees and taxes upfront.
Williamgat
March 17, 2026 at 8:21 pmНужен дизайн участка? ландшафтный дизайн цена под ключ проектирование и благоустройство участка с учетом рельефа, растений и стиля. Создаем красивые и функциональные решения для частных домов и дач, подбираем материалы и обеспечиваем качественную реализацию проекта.
ChristopherShubs
March 17, 2026 at 8:24 pmsee available vendors – The layout is straightforward, making it simple to check different products.
JamesShubs
March 17, 2026 at 8:37 pmdiscover action flow – Helps create a rhythm for consistent advancement.
Jeffreyacubs
March 17, 2026 at 9:18 pmБесплатная консультация юриста по взысканию алиментов — первый шаг к защите ваших прав и интересов ребёнка. Переходите по запросу [url=https://www.pravovik24.ru/konsultatsii/yurist-po-alimentam/]консультация юриста по алиментам в Москве бесплатно[/url] и получите разбор именно вашей ситуации, узнайте порядок действий, какие нужно собрать документы и оценку перспектив дела. Поддержка на каждом этапе — от обращения в суд до фактического получения алиментых выплат. Запишитесь уже сегодня!
MatthewShubs
March 17, 2026 at 9:29 pmimplement creative ideas – I appreciate this message, acting on inspiration leads to growth.
WilliamIdeot
March 17, 2026 at 9:40 pmБрендирование сувениров https://4youcreation.kz/uf-pechat/ в Алматы по современным технологиям. Специалисты предлагают лазерную гравировку, УФ-печать и термоперенос на ткани, стекло, металл и пластик. Организуют доставку по всему Казахстану.
Frankspora
March 17, 2026 at 9:42 pmКомпания FarbWood https://farbwood.by предлагает пиломатериалы из сибирской лиственницы для частного и коммерческого строительства в Минске и по всей территории Минска. Мы работаем только с лиственницей сибирской, сосна и ель используются как дополнение к основному ассортименту древесины.
DavidShubs
March 17, 2026 at 9:43 pmexplore direction with focus – Focus sharpens effort and keeps progress moving forward.
Kevinraity
March 17, 2026 at 9:44 pmНужна накрутка соц сетей? накрутка просмотров в вк увеличение подписчиков, лайков и просмотров для продвижения аккаунтов. Быстрый старт, безопасные методы и живая активность помогут развить профиль и повысить вовлеченность в популярных социальных платформах.
MichaelShubs
March 17, 2026 at 9:51 pmcheck it out – Easy browsing and organized listings provide a hassle-free user experience.
DennisUsari
March 17, 2026 at 9:51 pmThe best porn generator ai nsfw video generator your fantasies remain strictly between you and the neural network. Instant, high-quality generation, extensive scenario and character customization.
Davidunaxy
March 17, 2026 at 9:54 pmНовое в категории: https://lifeposi.ru/rasczenki-na-demontazhnye-raboty-v-moskve-i-mo-40999/
DonaldShubs
March 17, 2026 at 10:33 pmmove from thought to action – This resonates, implementation is what makes ideas valuable.
JohnShubs
March 17, 2026 at 10:49 pmcheck moving thoughts – Ideas only create impact when you follow through with action.
JamesShubs
March 17, 2026 at 11:00 pmvisit this site – Event details are easy to find, and the layout is very user-friendly.
JamesShubs
March 17, 2026 at 11:29 pmquick access – The site offers accessible lessons that make learning exciting.
PaulShubs
March 17, 2026 at 11:38 pmreduce the clutter – This resonates, less distraction improves focus.
RichardShubs
March 17, 2026 at 11:56 pmdiscover growth path – Progress is smoother when your direction is clearly outlined.
DavidShubs
March 18, 2026 at 12:10 amcheck this link – Great resource for understanding professional offerings and services in detail.
AndrewShubs
March 18, 2026 at 12:42 amplan for growth – This is practical, long-term thinking supports progress.
DavidShubs
March 18, 2026 at 12:44 amlearn more now – Streamlined website design ensures guests can check menu and booking info easily.
CharlesShubs
March 18, 2026 at 1:02 amdiscover sharp focus – Clarity in thinking leads to confident and precise actions.
RobertShubs
March 18, 2026 at 1:19 amexplore here – Fresh and appealing design draws attention and enhances the user experience.
KevinShubs
March 18, 2026 at 1:47 amfocus on the long term – This perspective is valuable, lasting growth takes time.
JohnShubs
March 18, 2026 at 1:56 amclick to view – Festive website experience makes signing up for the club effortless.
ChristopherShubs
March 18, 2026 at 2:10 amstart speed of focus – Directing attention carefully produces faster achievements.
JohnShubs
March 18, 2026 at 2:30 amdiscover details – The site is visually appealing and makes finding information quick and simple.
EdwardShubs
March 18, 2026 at 2:54 amsimplify your choices – This is helpful, removing confusion improves decision making.
MichaelShubs
March 18, 2026 at 3:09 amgo here – The tool simplifies locating theaters, making planning visits much easier.
MatthewShubs
March 18, 2026 at 3:16 amview fast insights – Understanding things clearly leads to quicker actions.
WilliamShubs
March 18, 2026 at 3:42 amopen this link – Latest sports news and highlights are easy to navigate and read.
JamesShubs
March 18, 2026 at 3:48 amopen the store – Everything loads fast, helping users explore and buy products without delay.
JasonShubs
March 18, 2026 at 3:58 amstep into action – This feels empowering, action drives meaningful outcomes.
JamesShubs
March 18, 2026 at 4:04 amenter the shop – The layout keeps everything simple and intuitive for shoppers.
RobertShubs
March 18, 2026 at 4:17 amclick for details – Daily focus ensures ideas are applied purposefully and effectively.
DonaldShubs
March 18, 2026 at 4:22 amsee pathway insights – Action opens up directions that weren’t obvious at first.
RichardShubs
March 18, 2026 at 4:51 amlearn more – Showcases community programs and resources in a clear and approachable way.
DavidShubs
March 18, 2026 at 4:53 amgo to this shop – Browsing feels effortless, with products easy to find and explore.
RyanShubs
March 18, 2026 at 5:02 amunlock clear thinking – This stands out, it promotes better understanding in confusion.
PaulShubs
March 18, 2026 at 5:28 amexplore clarity in motion – When direction is clear, actions become more focused and impactful.
WilliamShubs
March 18, 2026 at 5:28 amexplore here – Prompt actions generate momentum and keep projects on track efficiently.
JohnShubs
March 18, 2026 at 6:00 amstart browsing now – Overall, it provides an effortless, visually pleasant, and user-friendly shopping experience.
ThomasShubs
March 18, 2026 at 6:02 amdiscover details – Well-structured content provides practical approaches to foster meaningful social change.
NicholasShubs
March 18, 2026 at 6:07 amfollow your vision – Great message, a guiding purpose shapes consistent forward movement.
AndrewShubs
March 18, 2026 at 6:34 amstart building motion – Regular small actions help progress gain speed naturally.
JosephShubs
March 18, 2026 at 6:36 amexplore now – Focused effort ensures forward movement happens naturally.
ThomasShubs
March 18, 2026 at 7:04 ambrowse products – The layout is clean, helping users locate products and explore categories quickly.
JacobShubs
March 18, 2026 at 7:09 amconcentrate and grow – Nice message, focus is key to meaningful improvement.
CharlesShubs
March 18, 2026 at 7:11 amthis website – Eye-opening content raises awareness about risks to democratic institutions.
KennethShubs
March 18, 2026 at 7:46 amgain clear direction – Focused effort ensures you move forward with intention.
ThomasShubs
March 18, 2026 at 7:46 amvisit the page – A shared direction helps everyone contribute efficiently toward common goals.
ChristopherShubs
March 18, 2026 at 8:11 amdiscover items here – Browsing is effortless, letting visitors shop without complications.
JonathanShubs
March 18, 2026 at 8:16 amact on cues – Good takeaway, interpreting the right signals leads to meaningful results.
ChristopherShubs
March 18, 2026 at 8:19 amthis website – Organized layout helps users discover what’s happening in the park easily.
BrianShubs
March 18, 2026 at 8:55 amgain clear momentum – With clarity, forward movement becomes natural and consistent.
CharlesShubs
March 18, 2026 at 8:57 amclick to view – Clear strategy amplifies effort, making small actions more powerful.
FrancisNek
March 18, 2026 at 9:06 amLeading store buy discord servers with members gives media buyers access to aged, warmed, and verified profiles sorted by geo, trust level, and ad readiness. Each listing comes with complete access data including email, password, cookies, token, and user-agent string for seamless campaign setup. Marketplace standards ensure that every account performs as described — no surprises at checkout, login, or campaign launch.
HarryDub
March 18, 2026 at 9:06 amFull-service dealer bm face goes beyond selling by providing operational guides, restriction breakdowns, and platform update summaries. Transparent replacement policy covers the first-login window and ensures buyers receive exactly what is described on the product card. Scale your advertising operations on a foundation of quality — verified profiles, complete credentials, and expert operational support.
Kevinraity
March 18, 2026 at 9:07 amCertified platform buying gmail accounts tracks account health metrics proactively and notifies buyers of any status changes during the guarantee period. The knowledge base includes working guides for account warming, ad launch protocols, and reinstatement check procedures for reference. Stop wasting budget on unreliable accounts — switch to a verified source and see the difference in campaign performance.
Jerrykeemi
March 18, 2026 at 9:10 amVerified marketplace google ads invoice provides access to a wide catalog of digital profiles for advertising and media buying. The knowledge base includes working guides for account warming, ad launch protocols, and reinstatement check procedures for reference. Invest in verified account infrastructure and redirect the time saved from troubleshooting into actual campaign optimization work.
Michaelalush
March 18, 2026 at 9:11 amModern platform vintage instagram account for sale caters to solo buyers and agencies who need reliable accounts at scale with volume pricing and priority restocking. Transparent replacement policy covers the first-login window and ensures buyers receive exactly what is described on the product card. The combination of product quality, transparent specs, and responsive support creates a reliable foundation for scaling ad operations.
CharlesShubs
March 18, 2026 at 9:17 amopen the marketplace – Layout is straightforward, making vendor selection quick and user-friendly.
ScottShubs
March 18, 2026 at 9:22 amsharpen your vision – Strong insight, clarity makes execution smoother and more effective.
JosephShubs
March 18, 2026 at 9:30 amuse this page – Organized navigation helps visitors browse programs and resources with ease.
TimothyShubs
March 18, 2026 at 10:04 amdiscover forward energy – Channeling energy with purpose drives lasting and meaningful results.
ChristopherShubs
March 18, 2026 at 10:06 amread details – Concentrated direction preserves momentum and avoids delays.
MatthewShubs
March 18, 2026 at 10:22 amstart browsing now – Overall, the hub offers a clean, intuitive, and efficient way to explore vendors.
JustinShubs
March 18, 2026 at 10:27 amgive it a shot – Absolutely agree, trying is the only way to discover your path.
DanielShubs
March 18, 2026 at 10:39 amread here – Clear pricing breakdown ensures visitors can easily evaluate services and costs.
BarryMab
March 18, 2026 at 10:44 amCost-effective marketplace hotmail9 offers competitive rates without compromising on account quality, verification completeness, or delivery speed. The selection includes profiles sorted by registration method, warming protocol, age, and included assets so buyers can match accounts to their specific needs. Teams that prioritize account quality over raw volume consistently achieve better ROI and fewer campaign interruptions.
Robertirorn
March 18, 2026 at 10:44 amReliable source buy old reddit account with karma connects advertisers with thoroughly vetted profiles backed by replacement guarantees and dedicated support. Quality monitoring runs continuously — accounts are spot-checked after listing to maintain catalog integrity and buyer satisfaction rates. The most successful media buying teams share one trait: they invest in quality infrastructure before they invest in ad spend.
Charlesanype
March 18, 2026 at 10:46 amReliable source protonmail competitors connects advertisers with thoroughly vetted profiles backed by replacement guarantees and dedicated support. Geo-targeted options cover USA, UK, Germany, France, Poland, Ukraine, and other regions with proper IP history and locale settings. The most successful media buying teams share one trait: they invest in quality infrastructure before they invest in ad spend.
Zacheryagore
March 18, 2026 at 10:46 amQuality-focused marketplace yahoo accounts store runs multi-step verification on every listing before it reaches the catalog to protect buyer interests. The catalog is segmented by platform, geo, account type, and price tier to simplify navigation for both new and returning customers. Scale your advertising operations on a foundation of quality — verified profiles, complete credentials, and expert operational support.
Leonardnaf
March 18, 2026 at 10:47 amSpecialized store buy youtube monetized account focuses exclusively on accounts proven to perform in paid advertising with real spend history and trust indicators. Product cards display exact specifications including account age, verification level, included assets, geo origin, and current stock availability. Professional media buying starts with professional tools — source from a marketplace built by advertisers, for advertisers.
JasonShubs
March 18, 2026 at 11:14 amcheck action momentum – Action fuels movement and keeps everything advancing without pause.
DanielShubs
March 18, 2026 at 11:16 amcheck details – Organized strategies make progress consistent and predictable.
DonaldShubs
March 18, 2026 at 11:26 amcheck this website – Navigation is smooth, allowing users to shop quickly and efficiently.
BenjaminShubs
March 18, 2026 at 11:31 amprogress through action – Great idea, consistent effort creates meaningful results.
MatthewShubs
March 18, 2026 at 11:48 amcheck this link – Well-organized content makes learning about the campaign simple and effective.
Douglastwiny
March 18, 2026 at 11:59 amhttps://doskazaymov.kz/ где взять деньги если банки отказали – Doskazaymov помогает посмотреть график выплат
JeffreyShubs
March 18, 2026 at 12:20 pmclick for growth clarity – A clear mindset helps growth happen with less resistance.
MatthewShubs
March 18, 2026 at 12:23 pmread here – Breaking work into actionable steps helps focus energy and improve results.
PaulShubs
March 18, 2026 at 12:30 pmSeaStone Hub – Products are displayed neatly, making exploration simple.
AnthonyShubs
March 18, 2026 at 12:58 pmtap here – Everything about the festival is accessible and easy to navigate for visitors.
JacobShubs
March 18, 2026 at 1:25 pmstart shaping progress – Every step you take helps build a clearer and stronger path forward.
AnthonyShubs
March 18, 2026 at 1:33 pmexplore here – Clarity illuminates the path, allowing decisions to be made confidently.
AndrewShubs
March 18, 2026 at 1:35 pmdiscover items here – Navigation is intuitive, making it easy to explore and select products.
MarkShubs
March 18, 2026 at 2:08 pmtap here – Clear presentation of programs and schedules ensures visitors can plan efficiently.
NicholasShubs
March 18, 2026 at 2:32 pmdiscover clear focus – Focusing energy properly drives steady forward motion.
JoshuaShubs
March 18, 2026 at 2:38 pmCove Chic – Browsing is seamless, and the site has a welcoming feel.
DonaldShubs
March 18, 2026 at 2:42 pmtap here – Focused clarity allows momentum to grow and maintain strength throughout.
PaulShubs
March 18, 2026 at 3:17 pmthis link here – Well-designed and cute interface makes pet shopping easy to navigate.
StephenShubs
March 18, 2026 at 3:37 pmstart idea alignment – Organizing thoughts carefully helps achieve results without unnecessary mistakes.
BrianShubs
March 18, 2026 at 3:41 pmbrowse products – Shopping is fast and simple, with an intuitive interface.
MarkShubs
March 18, 2026 at 3:49 pmexplore here – Focused direction ensures that all efforts contribute effectively to the goal.
StevenShubs
March 18, 2026 at 4:27 pmdiscover details – User-friendly design allows library patrons to locate resources quickly.
ScottShubs
March 18, 2026 at 4:46 pmstart productive growth – Focus helps translate energy into meaningful forward movement.
EdwardShubs
March 18, 2026 at 4:47 pmrosebrookvendorhub.shop – Vendor listings are organized, allowing users to browse quickly and easily.
PaulShubs
March 18, 2026 at 4:57 pmquick access – Focus channels energy efficiently, ensuring smooth progress.
AndrewShubs
March 18, 2026 at 5:37 pmvisit this site – The website highlights inspiring programs and provides clear ways for the community to get involved.
TimothyShubs
March 18, 2026 at 5:52 pmRVC Selections – Exploring different vendors is quick and user-friendly.
BrandonShubs
March 18, 2026 at 5:54 pmdiscover growth direction – Having a clear path helps growth build steadily over time.
StevenShubs
March 18, 2026 at 6:03 pmclick for insight – Well-planned ideas push initiatives forward efficiently.
JoshuaShubs
March 18, 2026 at 6:45 pmfind out more – Clean design ensures users can access political resources without confusion.
HowardJab
March 18, 2026 at 6:49 pmЮридическая помощь по защите прав ребенка — это поддержка в самых важных ситуациях: от споров о месте проживания и алиментах до защиты от насилия и нарушения прав в школе. Переходите по запросу [url=https://www.pravovik24.ru/konsultatsii/yurist-po-pravam-rebenka/]юрист по правам ребенка консультация[/url] и квалифицированный юрист поможет отстоять интересы ребенка, подготовить документы и представить ваши интересы в суде, обеспечив безопасность и справедливость.
KennethShubs
March 18, 2026 at 7:10 pmtap here – Momentum grows naturally when goals and priorities are transparent.
JamesShubs
March 18, 2026 at 7:25 pmexplore coastharbor treasures – Browsing sections today was comfortable, with a tidy and well-organized design.
KevinShubs
March 18, 2026 at 7:54 pmcheck this link – Well-organized pages make browsing content simple and efficient.
GaryShubs
March 18, 2026 at 7:57 pmVendor Workshop Picks – The interface is simple, making vendor discovery quick.
JoshuaShubs
March 18, 2026 at 8:17 pmvisit this site – Clear thinking magnifies impact, letting small actions achieve bigger results.
DavidShubs
March 18, 2026 at 8:26 pmcoaststone finds – Layout is clean and structured, allowing effortless browsing of all categories.
NicholasShubs
March 18, 2026 at 9:00 pmVendor Silk Studio – The layout is intuitive and products are easy to navigate.
StephenShubs
March 18, 2026 at 10:04 pmSilverBrook Finds – Navigation feels natural and discovering vendors is easy.
TimothyShubs
March 18, 2026 at 10:19 pmcheck this site – The pages load nicely and information is easy to follow.
RichardShubs
March 18, 2026 at 10:27 pmdiscover copperstone treasures – The site design is intuitive, and checking items is smooth, simple, and pleasant.
dizayn studiya 357
March 18, 2026 at 10:36 pmстудии дизайна интерьера дизайнеров интерьеров
JamesShubs
March 18, 2026 at 10:36 pmclick here – Overall appealing design, easy navigation, and interesting content.
dizayn kottedzha 324
March 18, 2026 at 10:49 pmдизайн интерьера дома дизайн проект загородного дома стоимость
dizayn-interera-312
March 18, 2026 at 10:49 pmчастный дизайнер интерьера спб лучшие дизайн студии спб
JamesShubs
March 18, 2026 at 10:52 pmretroview – Layout is simple and engaging, makes browsing enjoyable.
JustinShubs
March 18, 2026 at 11:06 pmVendor House Listings – The interface is simple and product discovery feels natural.
ThomasShubs
March 18, 2026 at 11:27 pmsee coralharbor deals – Marketplace feels tidy, and exploring different sections today was pleasant.
JamesShubs
March 18, 2026 at 11:29 pmmotospot – Modern design, content is easy to navigate.
DavidShubs
March 18, 2026 at 11:49 pmfunportal – Has a lively, energetic feel that draws you in.
DavidShubs
March 18, 2026 at 11:52 pmonline store – The layout is modern and very user-friendly.
DavidShubs
March 18, 2026 at 11:53 pmartzonepaws – Unique and colorful, makes browsing a pleasure.
BrandonShubs
March 19, 2026 at 12:08 amSilver Collective Selections – Vendors and products are clearly displayed, making browsing hassle-free.
ChristopherShubs
March 19, 2026 at 12:27 amshop coralstone online – Pages load fast, and navigating different sections is straightforward.
MichaelShubs
March 19, 2026 at 12:36 amdailytrendnews – Well-structured interface, catching stories is simple.
JohnShubs
March 19, 2026 at 12:54 amvoice4change – The ideas are compelling and thoughtfully written.
JohnShubs
March 19, 2026 at 1:00 amclick here – Easy-to-follow content with a clean and organized presentation.
JohnShubs
March 19, 2026 at 1:24 amvendor hub – Interesting layout, I might come back to explore more.
MatthewShubs
March 19, 2026 at 1:30 amdiscover cottonbrook market – Layout feels organized, and exploring products was smooth and pleasant.
DavidShubs
March 19, 2026 at 1:43 amdankglass360 – Bright and organized, makes exploring the site enjoyable.
ThomasShubs
March 19, 2026 at 1:57 amonlinecrowd – Fun and lighthearted design, browsing is very enjoyable.
RichardShubs
March 19, 2026 at 2:11 amclick here – Pleasant, simple design that allows for smooth browsing throughout.
DonaldShubs
March 19, 2026 at 2:33 amcottonmeadowmarket – Browsing this market feels straightforward with fast-loading pages.
RobertShubs
March 19, 2026 at 2:49 ammusionetzone – Well-laid out pages, content is easy to access and read.
ChristopherShubs
March 19, 2026 at 2:58 amcorporatehub – Clean and professional layout, very easy to navigate.
RichardShubs
March 19, 2026 at 2:59 amvendor hub – It turned out to be more informative than I thought.
JamesShubs
March 19, 2026 at 3:24 amdiscover pier45 – Content flows nicely and the website is visually appealing overall.
ThomasShubs
March 19, 2026 at 3:24 amsnapgallery – Visually striking photos that feel polished and intentional.
PaulShubs
March 19, 2026 at 3:36 amshop creekharbor finds – Layout is simple and browsing different categories was effortless.
JamesShubs
March 19, 2026 at 3:47 amvision hub – Clean and modern layout with content that’s easy to understand.
JohnShubs
March 19, 2026 at 3:56 amgreektravels – Stunning imagery, inspires curiosity and travel ideas in Greece.
CharlesShubs
March 19, 2026 at 4:00 amzzmetazone – Straightforward design, makes reading and browsing pleasant.
CurtisKep
March 19, 2026 at 4:08 amфриланс заказы Подавляющее большинство предложений, таких как удаленная работа без звонков или возможность работать с телефона, делает онлайн-занятость доступной и комфортной, а отзывы реальных людей подтверждают ее преимущества.
DavidShubs
March 19, 2026 at 4:27 amonline shop link – Smooth experience with a range of items that catch attention.
JamesShubs
March 19, 2026 at 4:29 amnavigation center – Simple design, exploring content was fast and convenient.
ThomasShubs
March 19, 2026 at 4:30 amshop link – Smooth navigation and a clean, professional layout.
AndrewShubs
March 19, 2026 at 4:37 amshop creekstone finds – Marketplace structure is simple and checking products was convenient.
DavidShubs
March 19, 2026 at 4:50 amnew path guide – Clean and structured content that’s easy to explore and follow.
RandomNameShubs
March 19, 2026 at 4:54 amhappy lifestyle – Engaging material with a cheerful and simple design.
MatthewShubs
March 19, 2026 at 5:03 amscorehub – Clear updates and highlights, very enjoyable to read.
WilliamShubs
March 19, 2026 at 5:05 amkatemonline – Clear and approachable, pages are easy to navigate.
DavidShubs
March 19, 2026 at 5:30 amshop latest items – Products are clearly arranged and easy to browse.
JohnShubs
March 19, 2026 at 5:31 amapktools – Handy layout, downloads are straightforward and clear.
KennethShubs
March 19, 2026 at 5:36 amcrowncove shop online – Layout is elegant and moving through sections feels natural and calm.
JohnShubs
March 19, 2026 at 5:53 amgrowth center – Smooth interface with clear sections for quick comprehension.
ChristopherShubs
March 19, 2026 at 6:00 amexplore mosscrest – Everything feels natural and user-friendly.
DonaldShubs
March 19, 2026 at 6:06 aminnovationzone – Tech-focused, clear, and easy to navigate.
RichardShubs
March 19, 2026 at 6:12 amBucbstrikeonline – Well-structured interface, browsing content is smooth and convenient.
JohnShubs
March 19, 2026 at 6:35 amporns – Site loads fast, content is clear and straightforward to access.
BrianShubs
March 19, 2026 at 6:36 amcrownstoneemporium – Emprorium marketplace here seems organized and friendly to explore.
RichardShubs
March 19, 2026 at 6:36 amtake part here – Smooth navigation and important content that feels relevant.
RichardShubs
March 19, 2026 at 6:57 amlearn explore grow – Well-structured sections with encouraging and easy-to-follow messages.
MarkShubs
March 19, 2026 at 7:10 amstudyportal – Easy-to-follow layout and informative content throughout.
ThomasShubs
March 19, 2026 at 7:21 amdolcihub – Simple and clear, browsing favorites is easy.
MatthewShubs
March 19, 2026 at 7:32 ammossvendorcollective – Enjoyed looking around here, layout makes things simple to find.
ThomasShubs
March 19, 2026 at 7:37 amquick info – Clear interface and organized layout for fast access.
EdwardShubs
March 19, 2026 at 7:40 ambrowse crystalcove selections – Elegant boutique site with smooth navigation makes browsing easy.
CharlesShubs
March 19, 2026 at 7:41 amachievement portal – Smooth flow of information and structured pages make reading easy.
ThomasShubs
March 19, 2026 at 8:03 amadvancement path – Neatly structured pages with positive and motivating messaging.
KennethShubs
March 19, 2026 at 8:15 amcatherinewrites – The site feels welcoming and intimate, very enjoyable to browse.
Arthursop
March 19, 2026 at 8:22 amhttps://www.zorini.ru/ zorini
CharlesShubs
March 19, 2026 at 8:31 amdietzmanncenter – Well-organized and neat, navigation feels smooth.
CharlesShubs
March 19, 2026 at 8:39 amvisit marketplace – The overall experience feels clean and user-oriented.
TimothyShubs
March 19, 2026 at 8:40 amvisit crystalstone emporium – Well-organized emporium layout made exploring simple and pleasant.
ChristopherShubs
March 19, 2026 at 8:42 amteamcollabhub – Clean and modern layout, navigation feels simple.
DonaldShubs
March 19, 2026 at 9:02 amonline shop page – The information is straightforward and well-organized.
ChristopherShubs
March 19, 2026 at 9:08 amcurious world – Clean interface and smooth navigation make reading and exploring enjoyable.
EdwardShubs
March 19, 2026 at 9:20 amurbanjourneyhub – Smooth navigation with an uncluttered layout makes exploring easy.
JosephShubs
March 19, 2026 at 9:40 amrosetemplatezonehub – Well-laid-out pages, browsing templates feels effortless.
ChristopherShubs
March 19, 2026 at 9:43 amcompra express – Smooth pages with products clearly listed and accessible.
JeffreyShubs
March 19, 2026 at 9:44 amdaisycove shop online – Simple and clean pages made navigating the site effortless.
MatthewShubs
March 19, 2026 at 9:45 amdiscover this – Thoughtful content and a polished look, worth exploring.
MatthewShubs
March 19, 2026 at 10:12 amexplore options – Organized pages with concise content make exploring quick and easy.
RonaldShubs
March 19, 2026 at 10:24 ameventboard – Simple and clean interface, makes planning smooth.
PaulShubs
March 19, 2026 at 10:32 amexplore vendor – It’s easy to navigate and the info is practical.
MatthewShubs
March 19, 2026 at 10:44 amcheck it out – The minimalist style keeps things fast and simple.
DonaldShubs
March 19, 2026 at 10:49 amvaluediscoveries – Simple layout, content feels straightforward and understandable.
JacobShubs
March 19, 2026 at 10:50 amvisit daisystone bazaar – Neat layout with fast-loading pages, exploring the site was pleasant.
ChristopherShubs
March 19, 2026 at 10:51 amhanacenter – Informative layout, browsing through sections is smooth.
DonaldShubs
March 19, 2026 at 11:17 amdaily deals online – Smooth interface and simple navigation make it convenient.
JasonShubs
March 19, 2026 at 11:29 amnoholand – Content is concise and easy to follow.
JoshuaShubs
March 19, 2026 at 11:46 amwatch instantly – Pages render quickly and moving between them feels seamless.
NicholasShubs
March 19, 2026 at 11:50 amdawnridgeoutlet – Outlet store platform seems smooth and comfortable exploring pages.
PaulShubs
March 19, 2026 at 11:51 amfuture hub – Organized content and encouraging tone make visiting worthwhile.
DanielShubs
March 19, 2026 at 12:00 pmpourvousstore – Clean design, products are easy to explore and appealing.
AndrewShubs
March 19, 2026 at 12:05 pmproduct page – It loads quickly and keeps things simple and clean.
PaulShubs
March 19, 2026 at 12:23 pmcreate and learn – Neatly presented pages with messages that are easy to follow.
RyanShubs
March 19, 2026 at 12:34 pmholidayreindeer – Lighthearted and warm, very pleasant browsing experience.
BrianShubs
March 19, 2026 at 12:49 pmmining starter link – Clear presentation helps beginners understand concepts quickly.
JonathanShubs
March 19, 2026 at 12:51 pmbrowse dawnstone offers – Easy navigation, clean interface, and enjoyable to explore vendors.
AndrewShubs
March 19, 2026 at 12:53 pmdailyinsighthub – Clean presentation, content feels current and relevant.
MatthewShubs
March 19, 2026 at 1:10 pmdinahportal – Personal and tidy, site feels inviting and smooth.
AndrewShubs
March 19, 2026 at 1:26 pmpresent ideas – Well-laid-out interface with smooth browsing and appealing product visuals.
JacobShubs
March 19, 2026 at 1:37 pmfaithview – Approachable and sincere, makes a lasting impression.
JoshuaShubs
March 19, 2026 at 1:38 pmexplore vendor – Clean design helps everything feel organized and accessible.
MichaelTache
March 19, 2026 at 1:51 pmВысокопрочные болты хорошо показывают себя там, где важны повторяемость, удобство монтажа и уверенная фиксация деталей между собой Это удобно для регулярных поставок и серийной сборки https://metizy-optom-moskva.ru/
StevenShubs
March 19, 2026 at 1:51 pmcreative gallery – Simple navigation with content that feels artistic and fresh.
LarryShubs
March 19, 2026 at 1:53 pmvisit driftbrook deals – Pleasant browsing experience, interface intuitive and sections well-organized.
KennethShubs
March 19, 2026 at 1:57 pmsuccess hub – Concise sections with easy-to-follow content, simple yet engaging.
Jamesfak
March 19, 2026 at 2:03 pmАроматные подарки ручной работы создаются с особым вниманием к деталям и эстетике. Они могут стать стильным украшением интерьера и приятным элементом домашней атмосферы. Посмотреть идеи подарков можно по ссылке https://aroma-lavka.ru/
AnthonyShubs
March 19, 2026 at 2:18 pmmacallenzone – Well-structured pages, learning about the building is smooth and easy.
KennethShubs
March 19, 2026 at 2:36 pmmarket watch – Organized layout and easy-to-read sections make exploring enjoyable.
ScottShubs
March 19, 2026 at 2:41 pmtoddstarneshub – Easy-to-navigate sections, layout is simple and clear.
MarkShubs
March 19, 2026 at 2:55 pmread more – The page is arranged in a way that’s simple to digest.
ScottShubs
March 19, 2026 at 2:56 pmcheck driftorchard bargains – Easy-to-navigate marketplace, exploring products felt simple and convenient.
BrianShubs
March 19, 2026 at 3:01 pmideahubonline – Practical design, navigating through ideas is effortless.
KevinShubs
March 19, 2026 at 3:11 pmshop link – Pages are clear and the information is easy to digest.
DonaldShubs
March 19, 2026 at 3:25 pmnanacasa – Friendly and aesthetic, browsing feels smooth.
BrianShubs
March 19, 2026 at 3:45 pmsmart pick hub – Neatly organized pages with easy-to-read sections for quick comprehension.
StephenShubs
March 19, 2026 at 3:45 pmheartsofthenation – Engaging material, encourages reflection and deeper thought.
dizayn interera-]192
March 19, 2026 at 3:47 pmдизайна интерьера студия дизайна в спб
MichaelTache
March 19, 2026 at 3:48 pmКрепеж для сэндвич панелей часто используют там, где важны точная посадка, удобная сборка и предсказуемая работа крепежа в эксплуатации Это удобно для регулярных поставок и серийной сборки https://metizy-optom-moskva.ru/
dizayn kottedzha 579
March 19, 2026 at 3:49 pmиндивидуальный дизайн проект дома дизайн проект коттеджа
KennethShubs
March 19, 2026 at 3:58 pmdashboard – Clean layout makes moving between sections fast and effortless.
EdwardShubs
March 19, 2026 at 4:05 pmbuilding unity – Professional feel and clear explanations throughout the pages.
MarkShubs
March 19, 2026 at 4:33 pmeleanacenter – Neat layout with clear sections, very user-friendly.
EdwardShubs
March 19, 2026 at 4:44 pmexplore items – I found it interesting and helpful after a short visit.
JustinShubs
March 19, 2026 at 4:48 pmcityguide – Navigation feels natural, very user-friendly and smooth.
dizayn studiya 301
March 19, 2026 at 4:50 pmдизайн студии санкт петербурга дизайн проект купить
EdwardShubs
March 19, 2026 at 4:51 pmbest picks hub – Well-laid-out pages and concise content make exploring easy.
RonaldShubs
March 19, 2026 at 5:01 pmpomni resource page – A clean interface ensures users can find information without hassle.
JasonShubs
March 19, 2026 at 5:11 pmbusinessboosthub – Practical content, encourages growth and learning.
PaulShubs
March 19, 2026 at 5:41 pmcnsbiodeskhub – Professional and tidy, content is very readable.
FrankShubs
March 19, 2026 at 5:51 pmcleanupcrew – The content feels actionable and positive.
TimothyShubs
March 19, 2026 at 5:57 pmtrend boutique – Neatly arranged pages with easy-to-follow and engaging content.
GaryShubs
March 19, 2026 at 6:06 pmranking hub – Professional and organized layout with information easy to find.
RyanShubs
March 19, 2026 at 6:16 pmchic fashion finds – Stylish interface and well-organized sections make shopping fun.
TimothyShubs
March 19, 2026 at 6:20 pmvisit ztrategies – Everything is organized clearly, and browsing is smooth and convenient.
MichaelTache
March 19, 2026 at 6:49 pmКровельные саморезы нужны для профнастила и металлочерепицы, где важны герметичность и надежный прижим Такой крепеж помогает сократить количество переделок и сохранить стабильный результат на объекте https://metizy-optom-moskva.ru/
StevenShubs
March 19, 2026 at 6:50 pmspottinghub – Unique layout, murals are fun to scroll through and discover.
PatrickShubs
March 19, 2026 at 6:55 pmcozycorner – Calm layout with a very inviting reading experience.
JeffreyShubs
March 19, 2026 at 7:04 pmvisit platform – Everything feels cohesive and the purpose is easy to grasp.
ScottShubs
March 19, 2026 at 7:09 pmview this platform – Quick performance combined with a clear, uncluttered interface.
GaryShubs
March 19, 2026 at 7:21 pmbrandessentials – Well-organized, makes understanding branding basics simple.
JeffreyShubs
March 19, 2026 at 7:54 pmvisit this page – The overall design is attractive and easy to navigate.
AndrewShubs
March 19, 2026 at 7:58 pmraseczonehub – Trustworthy design, content is straightforward and accessible.
StephenShubs
March 19, 2026 at 8:12 pmvisit store – A visually pleasing design with smooth browsing throughout.
JacobShubs
March 19, 2026 at 8:14 pmfuture connections – Clean pages with clear, approachable content throughout the site.
Jamesfak
March 19, 2026 at 8:21 pmАроматные подарки ручной работы создаются с особым вниманием к деталям и эстетике. Они могут стать стильным украшением интерьера и приятным элементом домашней атмосферы. Посмотреть идеи подарков можно по ссылке https://aroma-lavka.ru/
EricShubs
March 19, 2026 at 8:27 pmgrowth strategy center – Easy navigation and clear presentation make it simple to explore.
KennethShubs
March 19, 2026 at 9:04 pmsafechargecenter – Reliable and clean, browsing advice feels intuitive.
tenzo2cup
March 19, 2026 at 9:14 pmТензоприбор предлагает калибровочные гири для весов нужного класса точности и номинальной массы для калибровки весов.
В нашей компании можно купить [url=https://www.tenzo-pribor.ru/catalog/giri/]гири для калибровки весов[/url] классов точности E1, E2, F1, F2, M1, M2.
Чем выше класс точности, тем меньше будет разница между номинальным и действительным значениями массы калибровочной гири.
JustinShubs
March 19, 2026 at 9:15 pmnews portal link – A simple interface that keeps updates quick and readable.
NicholasShubs
March 19, 2026 at 9:20 pmopportunity finder – Clean and simple navigation with clear, engaging information.
CharlesShubs
March 19, 2026 at 9:28 pmOlive Marketplace – Explored the site today and the navigation feels straightforward.
GaryShubs
March 19, 2026 at 9:30 pmbuild your pc – The content is easy to follow and quite informative.
LarryShubs
March 19, 2026 at 9:33 pmdealstream – Clean and clear, browsing deals is smooth.
Jamesfak
March 19, 2026 at 9:58 pmПодарки ручной работы с ароматами лаванды, ванили или цитрусов помогают создать спокойную и уютную атмосферу. Они могут стать отличным дополнением интерьера и приятным сюрпризом для близких людей. Подробнее по ссылке https://aroma-lavka.ru/
BenjaminShubs
March 19, 2026 at 10:17 pminfo portal – Smooth interface with organized, easy-to-read content.
ChristopherShubs
March 19, 2026 at 10:44 pmsupplier marketplace – Browsed today and the site is clean, easy to read, and structured.
NicholasShubs
March 19, 2026 at 11:10 pmclick for info – I appreciate how easy it is to follow along.
GregoryShubs
March 19, 2026 at 11:19 pmlink search – Smooth and easy-to-follow pages with links presented neatly.
dizayn doma 542
March 19, 2026 at 11:36 pmдизайн проект интерьера коттеджа https://dizayn-interera-doma.ru
NathanBoive
March 19, 2026 at 11:42 pmThe best porn generator porngen your fantasies remain strictly between you and the neural network. Instant, high-quality generation, extensive scenario and character customization. Available 24/7. For adults.
VictorVop
March 19, 2026 at 11:45 pmТолько лучшие материалы: https://song.link/dezavtor1
MatthewShubs
March 19, 2026 at 11:58 pmopalvendorcollective – Quick look earlier and the site feels quite easy navigating.
JamesShubs
March 20, 2026 at 12:16 amDiscover now – Quick review indicates everything is functional and straightforward.
AlexanderShubs
March 20, 2026 at 12:21 amkrusaders info – Clear and concise layout makes finding content effortless.
StephenShubs
March 20, 2026 at 12:47 amvisit pixelmoar – The interface is fresh and browsing feels smooth.
JamesShubs
March 20, 2026 at 1:00 amLaunch website – Smooth experience and everything seems organized.
DavidShubs
March 20, 2026 at 1:21 amLook at this – Seems useful, I’ll likely come back for further exploration.
JustinShubs
March 20, 2026 at 2:17 amverified business network – Simple, professional presentation with trustworthy content throughout.
DavidShubs
March 20, 2026 at 2:19 amExplore here – Simple interface and no issues while browsing.
JohnShubs
March 20, 2026 at 2:29 amQuick visit – Everything works smoothly and the layout is easy to follow.
LarryShubs
March 20, 2026 at 2:32 amvip elite jerseys – Everything looks well organized and engaging to browse.
JamesShubs
March 20, 2026 at 2:33 amGo to Lark Marketplace – Well-organized layout and fast loading pages.
PaulShubs
March 20, 2026 at 2:34 amsupplier hub online – Took a glance at this marketplace and the design feels user-friendly.
JamesShubs
March 20, 2026 at 2:57 amvisit this link – Everything feels organized and navigating is easy and quick.
JamesShubs
March 20, 2026 at 3:22 amtap here – Structured ideas transform into progress naturally and efficiently.
FrankShubs
March 20, 2026 at 3:22 amgrowthteamconnect – Motivating layout, exploring pages is straightforward and clear.
PaulShubs
March 20, 2026 at 3:22 amexplore site – Smooth interface with minimal clutter helps users focus on reading.
JohnShubs
March 20, 2026 at 3:30 amrbncvbr.shop – Not bad honestly, looks clean and easy to navigate through.
JamesShubs
March 20, 2026 at 3:30 amvisit this guide – Great ideas, when applied thoughtfully, create steady and tangible progress.
ThomasShubs
March 20, 2026 at 3:35 amLook at this – Found it unexpectedly and everything works seamlessly.
JamesShubs
March 20, 2026 at 3:43 amvisit product hub – Pages respond fast, and content is well organized.
MichaelShubs
March 20, 2026 at 3:46 amLavender Store – Everything is simple, well laid out, and easy to use.
AndrewShubs
March 20, 2026 at 3:46 amPearl Crest Vendor Place – Just explored today and the design feels clean, simple, and easy to navigate.
MichaelShubs
March 20, 2026 at 3:57 amclick to visit – The interface feels polished and easy to understand at a glance.
FrankShubs
March 20, 2026 at 4:03 amquick access – It gives a reliable impression and is worth revisiting.
MichaelShubs
March 20, 2026 at 4:04 amexplore now – The interface loads quickly and moving between sections is easy.
CharlesShubs
March 20, 2026 at 4:09 amdriftmeadowmarketplace.shop – Pages load quickly, and navigating the site feels smooth and effortless.
JamesShubs
March 20, 2026 at 4:18 amview more info – Pages respond instantly, and the layout is user-friendly.
JamesShubs
March 20, 2026 at 4:24 amlearn more now – Clear vision helps translate ideas into real, measurable progress.
AndrewShubs
March 20, 2026 at 4:25 amvisit shop – Fast-loading pages and easy navigation improve the experience.
JamesShubs
March 20, 2026 at 4:33 ammore info here – Turning inspiration into execution ensures progress develops steadily.
MichaelShubs
March 20, 2026 at 4:37 amQuick v1av4 visit – Pages load instantly and layout is simple to follow.
ChristopherShubs
March 20, 2026 at 4:40 amVisit platform – Well-organized sections make browsing straightforward.
DavidShubs
March 20, 2026 at 4:48 amcheck out this marketplace – The layout is clean, making browsing effortless.
KennethShubs
March 20, 2026 at 4:58 amPearl Supplier Hub Online – Browsed the site briefly and the interface is clean and well organized.
DavidShubs
March 20, 2026 at 4:58 amLavender Vendor Online – Clean interface with minimal delays while browsing.
DavidShubs
March 20, 2026 at 4:59 amexplore coral meadow – Everything is organized, making it easy to find what you need.
ChristopherShubs
March 20, 2026 at 5:06 amBrowse this – Structure feels clear and it’s easy to understand.
DavidShubs
March 20, 2026 at 5:12 amvisit the collective – The layout is neat and browsing feels effortless.
DavidShubs
March 20, 2026 at 5:21 amview more info – Everything is arranged clearly, making browsing fast and simple.
MichaelShubs
March 20, 2026 at 5:24 amprogressfollowsclarity.click – Focused thinking guides projects forward efficiently and without obstacles.
KevinShubs
March 20, 2026 at 5:25 amstart here – The site is easy to use with a clean and simple structure.
DavidShubs
March 20, 2026 at 5:37 amcheck proactive flow – Action ensures processes move in a structured and manageable way.
RobertShubs
March 20, 2026 at 5:45 amOpen resource – Looks intriguing, I’ll likely spend extra time on it later.
DanielShubs
March 20, 2026 at 5:46 amAccess page – Feels very intuitive with simple navigation throughout.
JohnShubs
March 20, 2026 at 5:52 amvisit product hub – Everything loads fast, and navigating through pages is simple.
JohnShubs
March 20, 2026 at 6:01 amcottongroveexchange.shop – The interface is clean, and navigation is simple to follow.
BrianShubs
March 20, 2026 at 6:10 amPebble Vendor Portal – Browsed today and the listings are simple and straightforward.
RobertShubs
March 20, 2026 at 6:10 amLeaf Market Platform – Smooth browsing, I might come back later for more details.
RobertShubs
March 20, 2026 at 6:20 amexplore now – The layout is clear and pages load promptly.
DavidShubs
March 20, 2026 at 6:26 amread this page – Structured thinking keeps projects on track and progressing smoothly.
JohnShubs
March 20, 2026 at 6:27 amtake a look here – The design is simple, and moving through content is effortless.
EdwardShubs
March 20, 2026 at 6:27 amstart browsing – Quick-loading pages and an organized layout make it easy to explore.
JohnShubs
March 20, 2026 at 6:40 ammore info here – Building traction step by step keeps momentum strong and predictable.
MatthewShubs
March 20, 2026 at 6:51 amVisit platform – Pages load quickly, and the interface is very clear.
WilliamShubs
March 20, 2026 at 6:52 amOpen resource – Pages load easily and the site is easy to follow.
ThomasShubs
March 20, 2026 at 6:55 ambrowse products here – Pages load fast, and navigation flows naturally.
ChristopherShubs
March 20, 2026 at 6:59 amview collection – Pages feel well-organized, making exploration easy.
EdwardShubs
March 20, 2026 at 7:22 amPebblewood Marketplace Portal – Just visited and the layout appears well structured and effortless to use.
JohnShubs
March 20, 2026 at 7:22 amGo to Lemon Hub – Smooth interface and the overall design feels organized and fresh.
RobertShubs
March 20, 2026 at 7:25 amuseful link – Proper execution ensures growth advances steadily and is easy to measure.
WilliamShubs
March 20, 2026 at 7:28 ammeadowstonecourtyard.shop – The layout is clean and moving through pages feels effortless.
TimothyShubs
March 20, 2026 at 7:29 amdownload hub – Tools are easy to find and the whole process feels smooth and fast.
JohnShubs
March 20, 2026 at 7:29 amvisit this page – The layout is simple, making exploration quick and easy.
RichardShubs
March 20, 2026 at 7:41 amthis link here – Maintaining control over momentum results in steady and purposeful progress.
CharlesShubs
March 20, 2026 at 7:56 ambrowse this shop – Everything is well-structured, and moving between sections is simple.
BrianShubs
March 20, 2026 at 7:56 amCheck this site – The site looks clean and everything is well organized.
DanielShubs
March 20, 2026 at 7:58 amenter creek harbor – Navigation is simple and the pages load without delay.
ChristopherShubs
March 20, 2026 at 8:01 amVisit DaisyVendor – Clean design and everything feels well organized.
Brucefed
March 20, 2026 at 8:21 amhttps://narcolog74.ru/
JohnShubs
March 20, 2026 at 8:25 amstart here – Modern interface helps users browse and buy products quickly.
JosephShubs
March 20, 2026 at 8:30 amopen this link – Clean structure and responsive pages make using the site enjoyable.
JeffreyShubs
March 20, 2026 at 8:31 amgame portal – Everything is quick to access with a tidy interface.
TimothyShubs
March 20, 2026 at 8:37 amPinestone Online Vendor – Explored today and the pages feel well structured and accessible.
WilliamShubs
March 20, 2026 at 8:37 amExplore Marble Vendor House – Layout is clean and nothing seems cluttered or confusing.
WilliamShubs
March 20, 2026 at 8:37 amvisit this link – The interface is tidy and moving between pages is effortless.
CharlesShubs
March 20, 2026 at 8:42 amuse this page – Proper direction ensures movement continues smoothly instead of stalling.
JosephShubs
March 20, 2026 at 8:59 amdiscover more – The interface is simple and helps users browse comfortably.
ChristopherShubs
March 20, 2026 at 9:00 amvisit the marketplace – Navigation feels intuitive, and the site is neatly structured.
EdwardShubs
March 20, 2026 at 9:01 amTry this page – Everything opens quickly and is easy to understand.
MatthewShubs
March 20, 2026 at 9:09 amJump to page – Clear design and smooth operation overall.
WilliamShubs
March 20, 2026 at 9:24 amuseful link – Clear and refined ideas support practical and efficient outcomes.
ChristopherShubs
March 20, 2026 at 9:32 amview more info – The layout is neat, and browsing feels comfortable.
JacobShubs
March 20, 2026 at 9:32 amgo to website – Clear sections and simple menus make it easy to move around.
Robertved
March 20, 2026 at 9:33 amПрофессиональная веб-студия разрабатывает сайты под ключ и занимается их эффективным SEO-продвижением. Помогает бизнесу заявлять о себе в сети и увеличивать продажи. Подробнее об услугах на сайте https://inuniver24.ru/
ThomasShubs
March 20, 2026 at 9:40 amvisit the outlet – The interface is clear and exploring each section is effortless.
DanielShubs
March 20, 2026 at 9:44 amvisit now – Direction channels momentum so progress continues without slowing.
GlennPedly
March 20, 2026 at 9:45 amадвокат для организаций ижевск Юридическая помощь бизнесу в Ижевске охватывает широкий спектр вопросов: от регистрации и реструктуризации до разрешения сложных споров и представительства в арбитражном суде.
RichardShubs
March 20, 2026 at 9:46 amVisit Mint Marketplace – Everything feels neat and the interface is user-friendly.
JeffreyShubs
March 20, 2026 at 9:47 amvendor listings center – Took a glance and the platform layout seems tidy and intuitive.
NicolasScupS
March 20, 2026 at 9:52 amCheck out http://www.bestguitarreview.com which provides honest guitar reviews with detailed specs and player ratings.
GilbertAlope
March 20, 2026 at 9:58 amSmart listeners best headphones 2026 read expert reviews to find the perfect headphones for their music style.
CharlesShubs
March 20, 2026 at 9:58 amdiscover more – The design is neat, making it easy to explore.
Rolandoamurl
March 20, 2026 at 10:01 amReliable source bestmicrophoneguide com ranks the best microphones of 2026 based on audio clarity and value.
MatthewShubs
March 20, 2026 at 10:01 ambrowse this shop – The layout is simple, and browsing between pages is smooth.
Rayfordduh
March 20, 2026 at 10:02 amBrain laboratory The Brain, Mind and Consciousness laboratory investigates high-level cognitive processes using brain imaging (fMRI), behavior and introspective reports. We are particulary interested in areas of overlap, as well as separation, between psychological processes involved in social cognition, mechanical reasoning, attention and self-awareness.
RonaldShubs
March 20, 2026 at 10:04 amExplore here – Some valuable content caught my attention; I might return.
DonaldRourf
March 20, 2026 at 10:08 amОбновлено сегодня: https://industry-portal24.ru/novosti/10430-vysokopoligonalnye-i-nizkopoligonalnye-3d-modeli-dlya-agr-zachem-oni-nuzhny-i-kak-ih-gotovyat-dlya-soglasovaniya-proekta.html
Hershelves
March 20, 2026 at 10:13 amподписки Большинство платформ постоянно расширяют свои возможности, предлагая дополнительные услуги и инструменты для продавцов и покупателей. Сфера подписок стремительно развивается, охватывая все новые ниши, помимо стриминговых сервисов и журналов.
AnthonyShubs
March 20, 2026 at 10:18 amVisit HollowCrate – Navigation feels easy and pages load without delay.
RichardShubs
March 20, 2026 at 10:22 amgo to page – Strategic effort promotes natural growth with minimal obstacles.
AnthonyShubs
March 20, 2026 at 10:45 amvisit now – Proper management of forward energy produces continuous and strong outcomes.
ChristopherShubs
March 20, 2026 at 10:46 amvisit this link – The interface responds quickly and browsing is effortless.
JosephShubs
March 20, 2026 at 10:55 amgo to this page – The site structure is easy to follow and visually appealing.
JacobShubs
March 20, 2026 at 10:56 amPlumbrook Marketplace – Checked a few pages and everything seems tidy and easy to navigate.
StevenShubs
March 20, 2026 at 10:57 amcheck the site – Pages are arranged clearly for a better browsing experience.
DonaldShubs
March 20, 2026 at 11:03 amMeadow Shop Online – Pleasant visit, all pages loaded correctly.
KennethShubs
March 20, 2026 at 11:10 amGo to site – Works without issues and everything is laid out neatly.
ThomasShubs
March 20, 2026 at 11:21 amreference link – Smart planning frameworks support steady advancement with minimal wasted effort.
Aaronmat
March 20, 2026 at 11:24 amЮридическая консультация по лишению родительских прав поможет оценить ситуацию, определить основания и выстроить грамотную стратегию защиты или подачи иска. Переходите по запросу [url=https://www.pravovik24.ru/konsultatsii/advokat-po-lisheniyu-roditelskikh-prav/]юридические услуги по лишению прав родителей[/url] – специалист разъяснит порядок действий и подготовит документы. Получите профессиональную поддержку и ответы на все вопросы уже на первой консультации.
PeterRuila
March 20, 2026 at 11:29 amкак добиться сквирта
DonaldShubs
March 20, 2026 at 11:30 amTry this page – Pages load without delay and the interface is simple.
MarkShubs
March 20, 2026 at 11:39 ambrowse this site – Pages load fast, and the interface is intuitive.
StephenShubs
March 20, 2026 at 11:39 amdiamondescort17 – Simple interface, pages load quickly and navigation feels smooth overall.
Joshuanem
March 20, 2026 at 11:42 amСоветы автомехаников https://proavtomaster.com полезные рекомендации по ремонту и обслуживанию автомобиля. Узнайте, как продлить срок службы двигателя, подвески и электрооборудования, избежать частых поломок и сэкономить на ремонте благодаря практическим советам специалистов.
DannyMob
March 20, 2026 at 11:43 amПрофессиональный автосервис https://km-motors.org кузовной ремонт, покраска авто, ремонт двигателя и подвески. Компьютерная диагностика, автоэлектрика, ТО, замена масла, фильтров и шиномонтаж. Работаем быстро, качественно и по стандартам производителей.
AlbertWag
March 20, 2026 at 11:43 amКомпания «Заборыч» https://заборыч.рф более 10 лет осуществляет строительство заборов из профнастила и сетки рабицы. Мы производим заборы для частных лиц и производственных объектов. За это время мы построили десятки объектов, от простых ограждений до сложных ландшафтных комплексов. Наши клиенты остаются довольны качеством работ и сроками реализации проектов.
DarrenCEd
March 20, 2026 at 11:44 amшлюхи уфа дали порно
PaulShubs
March 20, 2026 at 11:50 amexplore clear steps – Clarity in thought sets the foundation for steady advancement.
DanielShubs
March 20, 2026 at 11:50 amgo explore – Browsing is simple and content is easy to access.
AndrewShubs
March 20, 2026 at 11:55 amshop online now – Pages respond quickly and navigation feels seamless.
PaulShubs
March 20, 2026 at 12:05 pmWavestone Exchange – Clean design and fast loading made browsing feel effortless.
ThomasShubs
March 20, 2026 at 12:06 pmview this page – The setup is straightforward and easy to understand.
NicholasShubs
March 20, 2026 at 12:06 pmmarketplace hub – Browsed quickly and the layout appears organized, smooth, and user-friendly.
GeorgeShubs
March 20, 2026 at 12:13 pmCheck platform – The minimal design makes moving through the site effortless.
CharlesShubs
March 20, 2026 at 12:19 pmvisit the site – Careful planning and design shape growth in an efficient, consistent manner.
MichaelHiell
March 20, 2026 at 12:32 pmснять глэмпинг в подмосковье посуточно
MarkShubs
March 20, 2026 at 12:42 pmHollow Market – Navigation feels smooth and the layout is straightforward.
StevenShubs
March 20, 2026 at 12:42 pmsee details here – The site feels polished and browsing is smooth throughout.
LarryShubs
March 20, 2026 at 12:42 pmdigital hub – Pages load quickly and the structure is user-friendly.
JoshuaShubs
March 20, 2026 at 12:56 pmopen this link – The site makes searching for products very convenient.
GeorgeShubs
March 20, 2026 at 12:58 pmexplore proactive strategy – Only through consistent action does strategy truly create impact.
MatthewShubs
March 20, 2026 at 12:58 pmdiscover this site – The interface responds instantly and navigation is easy.
AndrewShubs
March 20, 2026 at 1:06 pmVisit Wave Willow – Easy to browse with content readily accessible.
CharlesShubs
March 20, 2026 at 1:16 pmopen this website – The overall browsing experience feels calm and seamless.
JonathanShubs
March 20, 2026 at 1:17 pmsupplier hub online – Checked a few sections and the layout feels logical, neat, and simple.
MarkShubs
March 20, 2026 at 1:17 pmDiscover now – Interface is clean and pages load without issues.
ChristopherShubs
March 20, 2026 at 1:17 pmexplore now – Simplified thought patterns help actions progress smoothly.
JeffreyVig
March 20, 2026 at 1:26 pmПрофессиональная помощь детям https://neuropsy-centr.ru с нарушениями речи и развития. Высококвалифицированные врачи, работаем с самыми тяжелыми случаями, 99% положительных отзывов, новейшее оборудование и инвентарь. Государственная лицензия: Л035-01298-77/01604531 от 09.12.24
MichaelNog
March 20, 2026 at 1:26 pmПлатная частная клиника https://mypsyhealth.ru/services/psikhiatricheskaya-klinika психиатрии, неврологии и наркологии — анонимное лечение и консультации специалистов. Диагностика, помощь при зависимостях, неврологических и психических расстройствах. Конфиденциальность, опытные врачи и комфортные условия.
Jamesvab
March 20, 2026 at 1:26 pmмодульный дом планировка https://modul-msk.ru
CharlesRef
March 20, 2026 at 1:27 pmТекущие рекомендации: https://eleven7.ru/muzhskaja-parfjumerija/
Oscarbrank
March 20, 2026 at 1:44 pmhttp://www.cricketworldcup.live
AndrewShubs
March 20, 2026 at 1:45 pmgo to this site – Everything loads fast, and navigation is straightforward.
ScottShubs
March 20, 2026 at 1:46 pmcheck offers – Products are easy to locate thanks to the clean interface.
PaulShubs
March 20, 2026 at 1:51 pmExplore HoneyCrate – Pages load quickly and the interface is intuitive.
KevinShubs
March 20, 2026 at 1:56 pmexplore this site – It’s well-organized and easy to move through different sections.
AndrewShubs
March 20, 2026 at 2:02 pmclick this link – Navigation feels natural without any confusing sections.
StevenShubs
March 20, 2026 at 2:02 pmread here – Following the right cues allows for clearer, more confident decisions.
JoshuaShubs
March 20, 2026 at 2:05 pmVisit Wheatbrook – Simple layout and fast-loading sections make it easy to use.
DanielShubs
March 20, 2026 at 2:16 pmgo to page – Fast and clear interface ensures finding daily deals efficiently.
AndrewShubs
March 20, 2026 at 2:20 pmGo to site – A distinctive website, might explore it further soon.
ChristopherShubs
March 20, 2026 at 2:25 pmclick here to explore – The interface is intuitive and easy to get around.
LarryShubs
March 20, 2026 at 2:28 pmQuartz Marketplace Portal – Just explored and the pages are tidy, structured, and easy to navigate.
JoshuaShubs
March 20, 2026 at 2:48 pmvisit this page – Smooth navigation and a clear structure make exploring easy.
SamuelShubs
March 20, 2026 at 2:48 pmvape shop – Smooth browsing and easy access to all products.
EdwardShubs
March 20, 2026 at 2:55 pmgo here now – Fast loading and clear structure improve usability.
StevenShubs
March 20, 2026 at 3:03 pmGo to site – Everything is laid out cleanly and works as expected.
KevinShubs
March 20, 2026 at 3:07 pmaccess the store – Everything is optimized for a seamless browsing experience.
BrianShubs
March 20, 2026 at 3:08 pmthis website – Properly channeled ideas enhance execution and maximize results.
BrianShubs
March 20, 2026 at 3:08 pmExplore Wheatstone – Neat layout and smooth browsing experience.
MatthewShubs
March 20, 2026 at 3:13 pmdiscoverhiddenpaths.shop – Engaging platform, exploring unique items was simple and enjoyable.
KevinShubs
March 20, 2026 at 3:24 pmLook at this – Fast loading pages and smooth navigation overall.
DanielShubs
March 20, 2026 at 3:34 pmbrowse this shop – The layout is engaging and transitions between pages are seamless.
JamesTor
March 20, 2026 at 3:36 pmкак определить и узнать usb 30 способы проверки версии и типа usb 30
Thomasnepsy
March 20, 2026 at 3:44 pmСкоро лето и жара купить кондиционер с установкой широкий выбор сплит-систем для квартиры, дома и офиса. Поможем подобрать модель по площади, бюджету и характеристикам. Установка под ключ, гарантия, доставка и выгодные цены на популярные бренды.
KevinShubs
March 20, 2026 at 3:47 pmvisit this link – The interface is clear, and pages load quickly for an effortless experience.
Matthewmycle
March 20, 2026 at 3:48 pmTop web design https://webdesignfirmshub.com companies worldwide: a selection of the best studios for website and interface creation. Learn about case studies, design approaches, UX/UI solutions, and innovations to help you choose a reliable contractor for your digital projects.
AlfredPlamy
March 20, 2026 at 3:49 pmTop branding agencies https://topbrandagencies.com worldwide: the best studios for brand development, corporate identity, and positioning. Portfolio reviews, strategies, and case studies will help you choose a reliable agency for business development and brand enhancement.
Davidfab
March 20, 2026 at 3:50 pmjeton game casino
LarryVew
March 20, 2026 at 3:51 pmTop UX/UI design https://uiuxagencies.com agencies: the best companies creating user-friendly interfaces and digital products. Explore case studies, methodologies, and approaches to UX/UI to choose a reliable contractor for your website or app.
JasonShubs
March 20, 2026 at 3:53 pmdawnharborcollective.shop – Everything runs smoothly and the layout feels easy to follow.
BrianShubs
March 20, 2026 at 4:08 pmonline store link – Navigation is simple and content is easy to understand.
KevinShubs
March 20, 2026 at 4:08 pmclick to view – Gradually constructing motion strengthens consistency and helps reach goals.
AnthonyShubs
March 20, 2026 at 4:11 pmgo to page – Clear design and organized categories make browsing effortless.
EdwardShubs
March 20, 2026 at 4:11 pmVisit Wild Harbor – Smooth navigation with quick-loading content on every page.
AndrewShubs
March 20, 2026 at 4:15 pmEnter Ice Hub – Fast performance with an intuitive structure.
JasonShubs
March 20, 2026 at 4:28 pmVisit platform – Easy to read, everything functions as expected.
MatthewShubs
March 20, 2026 at 4:43 pmcheck it out – The design is tidy and easy on the eyes.
EdwardShubs
March 20, 2026 at 4:45 pmclick here to explore – Fast-loading pages and a tidy interface make browsing enjoyable.
RyanShubs
March 20, 2026 at 4:51 pmtap here now – Fast loading and a tidy structure improve usability.
MarkShubs
March 20, 2026 at 5:14 pmcheck this out – Well-designed layout made exploring options simple and effective.
JasonShubs
March 20, 2026 at 5:15 pmWindcrest Finds – Straightforward layout and responsive pages make browsing simple.
JasonShubs
March 20, 2026 at 5:16 pmshop online now – Navigation is intuitive, and pages load quickly every time.
JeffreyShubs
March 20, 2026 at 5:16 pmopen this link – Focus channels potential into productive actions, avoiding wasted time.
Michaelrox
March 20, 2026 at 5:21 pmДубликаты номеров https://avtostrahovka36.ru в Воронеже — изготовление и восстановление регистрационных знаков по ГОСТ. Срочно за 1 день, качественные материалы, соответствие требованиям и выгодные цены. Оформление быстро и без очередей.
AndrewSot
March 20, 2026 at 5:22 pmA non-profit organization https://linkimpact.org dedicated to supporting multicultural families, environmental protection, volunteerism, and language and cultural exchange.
Myronplaup
March 20, 2026 at 5:22 pmПрактик о заборах https://sinta-kedr.ru/ честный разбор материалов, установки и стоимости. Узнайте плюсы и минусы разных видов заборов, частые ошибки и реальные сроки службы. Полезные рекомендации перед покупкой и монтажом ограждений.
KennethShubs
March 20, 2026 at 5:25 pmExplore IceVendor – Nice presentation and everything is easy to follow.
JeffreyShubs
March 20, 2026 at 5:32 pmLook at this – Surprised at the performance, operates better than I assumed.
JasonShubs
March 20, 2026 at 5:43 pmcheck this website – Everything loads quickly, and content is easy to locate.
MichaelPen
March 20, 2026 at 5:46 pmAn astrology portal burcler with daily horoscopes, natal charts, and forecasts. Online consultations, zodiac sign compatibility, and personalized recommendations will help you better understand yourself and make important decisions.
NicholasShubs
March 20, 2026 at 5:49 pmdiscover more here – Everything is laid out clearly for a smooth experience.
AnthonyShubs
March 20, 2026 at 5:52 pmbrowse this page – Everything is arranged logically and navigating is effortless.
DavidIlluh
March 20, 2026 at 6:08 pmПользуюсь рейтингами легальных казино уже давно и считаю это обязательным этапом перед регистрацией. Очень удобно, когда сразу видно, какие площадки надежные. Описания подробные, без лишней рекламы. Есть информация о выплатах и поддержке. Отличный инструмент для выбора: топ казино РФ
PaulShubs
March 20, 2026 at 6:12 pmquick access – User-friendly layout made finding unique items fast and simple.
RyanShubs
March 20, 2026 at 6:18 pmWindstone Store – Functional and organized, browsing is intuitive throughout.
JeffreyShubs
March 20, 2026 at 6:20 pmmore info here – Proper focus directs energy toward meaningful outcomes and continuous improvement.
PaulShubs
March 20, 2026 at 6:21 pmopen this site – Attractive pages and navigation feels effortless.
GaryShubs
March 20, 2026 at 6:37 pmView platform – The interface feels modern and navigation is effortless.
JoshuaShubs
March 20, 2026 at 6:38 pmEnter KeystoneVendor – Interface is minimalistic and navigation is easy.
RyanShubs
March 20, 2026 at 6:42 pmbrowse this page – The site is well-structured, and moving between sections is effortless.
JacobShubs
March 20, 2026 at 6:48 pmtap here to view – The structure makes moving through pages feel natural.
MarkShubs
March 20, 2026 at 7:01 pmvisit the website – Pages load quickly and moving through sections is simple.
StevenShubs
March 20, 2026 at 7:10 pmlearn more here – User-friendly layout makes browsing and shopping smooth.
NicholasShubs
March 20, 2026 at 7:21 pmGo to Woodbrook – Effortless browsing with a clear and user-friendly layout.
NicholasShubs
March 20, 2026 at 7:21 pmvisit this guide – Proper direction channels energy, keeping movement consistent and steady.
MarkShubs
March 20, 2026 at 7:21 pmenter the shop – Browsing is easy and the structure feels logical at every page.
JacobShubs
March 20, 2026 at 7:41 pmbrowse this site – Pages respond quickly, and the layout makes content easy to access.
JoseShubs
March 20, 2026 at 7:42 pmView platform – Functions well and loads quickly without noticeable hiccups.
JonathanShubs
March 20, 2026 at 7:47 pmbrowse this site – Everything is arranged logically for a smooth browsing experience.
KevinShubs
March 20, 2026 at 7:48 pmDiscover Lake Crate – Interface feels clean and moving around the site is effortless.
DavidIlluh
March 20, 2026 at 7:58 pmРейтинг легальных казино оказался полезным и информативным. Помог быстро выбрать площадку с хорошими условиями. Все данные актуальные и понятные. Есть сравнение и отзывы. Очень удобно: https://rating-casino-russia.ru/
AndrewShubs
March 20, 2026 at 8:08 pmvisit the platform – Efficient resource, everything was easy to locate without hassle.
PaulShubs
March 20, 2026 at 8:11 pmaccess the platform – The site looks polished and everything is easy to navigate.
DavidIlluh
March 20, 2026 at 8:24 pmС помощью рейтинга легальных казино удалось найти надежный сайт для игры. Есть вся необходимая информация для выбора. Описания подробные и понятные. Можно сразу оценить плюсы и минусы. Очень удобно – казино без верификации и паспорта
StephenShubs
March 20, 2026 at 8:24 pmcheck it out – Thoughtful idea flow allows projects to move forward smoothly and effectively.
ScottShubs
March 20, 2026 at 8:26 pmShop Outlet Online – Smooth performance with well-organized content.
StevenShubs
March 20, 2026 at 8:27 pmopen this shop – Pages are snappy and the layout is simple to follow.
GaryShubs
March 20, 2026 at 8:40 pmvisit this link – Everything is arranged clearly, and pages respond quickly.
ScottShubs
March 20, 2026 at 8:44 pmVisit GQVSLHWXKQNQLMJIKA – Found this interesting, might return to explore more later.
ScottShubs
March 20, 2026 at 8:45 pmcheck this website – Fast loading and a tidy structure make exploring effortless.
BrianShubs
March 20, 2026 at 9:00 pmExplore platform – Everything is working properly and loads fast.
JoshuaShubs
March 20, 2026 at 9:04 pmdiscover more – Clear interface ensures alternatives are easy to locate.
StevenShubs
March 20, 2026 at 9:19 pmenter this site – The navigation is intuitive and the organization feels natural.
ScottShubs
March 20, 2026 at 9:25 pmcheck continuous energy – Active steps generate their own drive, ensuring long-term results remain steady.
BrandonShubs
March 20, 2026 at 9:26 pmZen Harbor Marketplace – Clean, minimal design with intuitive and fast browsing.
MatthewShubs
March 20, 2026 at 9:26 pmVisit ilili1oulilil5 – The layout is surprisingly well done and caught me off guard.
KennethShubs
March 20, 2026 at 9:27 pmshop online now – The layout is neat and browsing feels very smooth.
TimothyShubs
March 20, 2026 at 9:38 pmvisit this district – The site is well-structured, making exploration easy and enjoyable.
BrandonShubs
March 20, 2026 at 9:42 pmtake a look here – The site is easy to navigate and content is clearly displayed.
KevinShubs
March 20, 2026 at 10:02 pmclick for insight – Intuitive design helps users locate and purchase products with ease.
MichaelShubs
March 20, 2026 at 10:10 pmv1av4 Main – Site loads fast and navigation is straightforward.
JamesShubs
March 20, 2026 at 10:11 pmmarketplace page – Just passing by, the design looks clean and user-friendly.
BrandonShubs
March 20, 2026 at 10:28 pmgo here – The right path ensures energy is spent wisely instead of carelessly lost.
SamuelShubs
March 20, 2026 at 10:28 pmvisit the marketplace – Everything functions properly, and exploring pages feels natural.
AndrewShubs
March 20, 2026 at 10:29 pmaccess the platform – The interface is fast and reliable.
EdwardShubs
March 20, 2026 at 10:29 pmopen this site – Smooth navigation with clear sections makes it easy to explore.
AdamShubs
March 20, 2026 at 10:36 pmtap here to view – Fast page loads and intuitive design make exploring the site easy.
PatrickShubs
March 20, 2026 at 10:39 pmgo to this site – Pages load quickly, and the interface is straightforward.
JamesShubs
March 20, 2026 at 10:46 pmopen the outlet page – First glance shows the design is tidy and straightforward.
BrianShubs
March 20, 2026 at 10:59 pmsee more info – Perfect for daily needs, browsing is seamless and easy.
JamesShubs
March 20, 2026 at 11:11 pmopen the emporium page – First glance shows the layout is tidy and user-friendly.
PatrickShubs
March 20, 2026 at 11:31 pmtap here – Proper attention guides execution, avoiding delays and wasted effort.
PatrickShubs
March 20, 2026 at 11:31 pmdiscover this collective – Layout is neat, and exploring content is intuitive.
DonaldShubs
March 20, 2026 at 11:34 pmbrowse this collection – Navigation flows naturally and the visuals are tidy.
NathanShubs
March 20, 2026 at 11:35 pmgo to this site – Pages respond quickly, and the structure keeps everything organized.
KennethShubs
March 20, 2026 at 11:39 pmExplore Courtyard – User-friendly design with smooth functionality.
RobertShubs
March 21, 2026 at 12:10 amacorn brook hub – Content looks well organized and easy to follow.
MichaelShubs
March 21, 2026 at 12:17 amVisit store – Well-organized layout with responsive pages makes exploring effortless.
TimothyShubs
March 21, 2026 at 12:27 amAccess Lantern Vendor – Pages load properly and the interface is simple.
GregoryShubs
March 21, 2026 at 12:33 amclick for thought focus – Clarity strengthens decision-making and reduces uncertainty.
Robertbusly
March 21, 2026 at 12:39 amДубликаты номеров https://avtostrahovka36.ru в Воронеже — изготовление и восстановление регистрационных знаков по ГОСТ. Срочно за 1 день, качественные материалы, соответствие требованиям и выгодные цены. Оформление быстро и без очередей.
JamesShubs
March 21, 2026 at 12:48 amopen the outlet page – First glance shows the design is tidy and straightforward.
JoshuaShubs
March 21, 2026 at 12:49 amLaunch Acornstone Exchange – Nice flow between pages and everything works as expected.
DavidShubs
March 21, 2026 at 1:10 amthis online shop – Spending a minute browsing and the structure seems pretty straightforward.
Richardkem
March 21, 2026 at 1:50 amПрактик о заборах https://sinta-kedr.ru/ честный разбор материалов, установки и стоимости. Узнайте плюсы и минусы разных видов заборов, частые ошибки и реальные сроки службы. Полезные рекомендации перед покупкой и монтажом ограждений.
DavidShubs
March 21, 2026 at 1:53 amView platform – Fast pages combined with tidy layout improve usability.
RichardShubs
March 21, 2026 at 2:11 amonline shop portal – Passing through the page and the design seems balanced.
Edmundodiory
March 21, 2026 at 2:17 amБесплатная консультация юриста по вопросам опеки и усыновления поможет разобраться в правах, подготовке документов и порядке оформления. Переходите по запросу [url=https://www.pravovik24.ru/konsultatsii/yurist-po-opeke/]адвокаты по опеке и попечительству[/url] – специалист подскажет, как действовать в вашей ситуации, оценит риски и предложит оптимальное решение. Получите профессиональную помощь по делам опеки и попечительства на каждом шаге без лишних затрат.
tut-novostroyki 127
March 21, 2026 at 2:27 amВсе новостройки https://tut-novostroyki.ru от застройщиков в Новосибирске — актуальный каталог квартир в новых ЖК. Цены, планировки, сроки сдачи и акции. Подберите квартиру напрямую от застройщика без комиссии с удобным поиском и проверенной информацией.
vseremontytut 698
March 21, 2026 at 2:28 amДизайнерское бюро https://vseremontytut.ru проектирование интерьера и ремонт под ключ. Разработка дизайн-проекта, 3D-визуализация, подбор материалов и полная реализация. Создаем стильные и функциональные пространства с гарантией качества и соблюдением сроков.
shpaklevka-sten 702
March 21, 2026 at 2:29 amШпаклевка стен https://shpaklevka-sten.ru и потолков в Москве — выравнивание поверхностей под покраску и обои. Качественные материалы, опытные мастера и соблюдение технологий. Выполняем работы быстро, аккуратно и с гарантией результата по доступной цене.
RandomNameShubs
March 21, 2026 at 2:31 amMoonridge Hub – Clear structure and very approachable interface.
DavidShubs
March 21, 2026 at 2:48 amthis online boutique – Browsing casually, the site structure seems well arranged.
RandomNameShubs
March 21, 2026 at 2:58 amVendor Dashboard – Well-laid-out structure, content is easy to digest.
ThomasShubs
March 21, 2026 at 3:10 amalpinestoneemporium – Pretty smooth experience, content layout makes reading easy today.
RobertShubs
March 21, 2026 at 3:26 amCheck it out – Smooth interface with well-structured sections makes browsing easy.
ChristopherShubs
March 21, 2026 at 4:09 amamber brook homepage – Quick visit today and the design seems tidy overall.
RandomNameShubs
March 21, 2026 at 4:11 amBirch Network – Organized structure, navigation is very intuitive.
JohnShubs
March 21, 2026 at 4:44 amshopping emporium link – Browsed casually, the layout feels tidy and accessible.
JohnShubs
March 21, 2026 at 4:59 amTake a look – Clear interface and responsive design make exploring effortless.
ChristopherShubs
March 21, 2026 at 5:08 amvisit amber brook – Noticed this site today and the structure seems nicely arranged.
RandomNameShubs
March 21, 2026 at 5:21 amBright Hub – Well-structured pages, very smooth to navigate.
DonaldShubs
March 21, 2026 at 6:06 amapricotbrookoutlet – Nice little discovery, layout is clean and navigation is easy.
WilliamShubs
March 21, 2026 at 6:31 amVisit link – Fast-loading pages with clear organization make browsing enjoyable.
RandomNameShubs
March 21, 2026 at 6:31 amCalm Cove Hub – Layout is tidy, browsing feels simple and straightforward.
RichardShubs
March 21, 2026 at 6:39 amcheck this bazaar – Took a quick look, the page appears neat and user-friendly.
RandomNameShubs
March 21, 2026 at 6:43 amBrook Vendor Space – Sections are clear, content is easy to locate.
PaulShubs
March 21, 2026 at 7:05 amonline shop portal – Looking through the page and everything seems nicely organized.
bytovayalavka 938
March 21, 2026 at 7:18 amБытовая химия в Казани https://bytovayalavka.ru широкий ассортимент средств для уборки, стирки и ухода за домом. Оригинальная продукция, выгодные цены и быстрая доставка. Подберите качественные моющие средства для чистоты и комфорта вашего дома.
shpaklevka msk 610
March 21, 2026 at 7:19 amМеханизированная шпаклевка https://shpaklevka-msk.ru современный способ выравнивания стен и потолков. Ровное нанесение, высокая скорость работ и экономия материалов. Подготовка под финишную отделку с гарантией качества и соблюдением технологий.
Adriangon
March 21, 2026 at 7:19 amCalculate your horoscope ulduz-fali com az online. Horoscopes, love compatibility, daily horoscopes and astrological interpretations by date of birth on one site.
Richardrix
March 21, 2026 at 7:20 amDream Interpretations 2026 yuxu-yozmalari learn the meaning of your dreams with AI artificial intelligence. Dream interpretation from A to Z, folk belief interpretation, psychological approach. Free online dream interpretation.
RandomNameShubs
March 21, 2026 at 7:43 amCanyon Vendor Network – Clear sections, content is easy to move through and read.
AndrewShubs
March 21, 2026 at 8:05 ambrowse aurora store – Looked around for a moment and the formatting seems balanced.
RichardShubs
March 21, 2026 at 8:06 amExplore here – Content is clear and moving through sections is smooth.
ThomasShubs
March 21, 2026 at 8:31 amshopping bazaar link – Browsed casually, the page feels user-friendly and accessible.
RandomNameShubs
March 21, 2026 at 8:53 amWorkshop Vendor Space – Clear sections, content is easy to find quickly.
JoshuaShubs
March 21, 2026 at 9:05 amopen the bazaar page – Just exploring briefly and everything seems tidy.
TeddyBorof
March 21, 2026 at 9:16 amAn online numerology https://numerologiya.com.az profile analyzes your destiny, talents, and finances. Accurate calculations, number interpretation, and personalized recommendations will help you better understand yourself and choose the right direction in life.
EverettDet
March 21, 2026 at 9:16 amЖіночий сайт https://zhinka.in.ua поради про красу, здоров’я, стосунки та стиль життя. Читайте корисні статті, лайфхаки, рецепти догляду та натхнення для сучасних жінок. Все про жіночу гармонію, саморозвиток і комфорт у повсякденному житті.
LeonardNic
March 21, 2026 at 9:16 amСайт міста Вінниця https://faine-misto.vinnica.ua новини, події, довідник компаній і корисна інформація для жителів та гостей. Актуальні новини, афіша, транспорт, послуги і все про життя міста в одному зручному онлайн-порталі.
Richardhak
March 21, 2026 at 9:16 amСайт міста Одеса https://faine-misto.od.ua новини, події, афіша, довідник компаній та корисна інформація. Дізнавайтесь актуальні новини, знаходьте послуги, заклади і маршрути. Все про життя Одеси для мешканців і гостей міста в одному місці.
JosephShubs
March 21, 2026 at 9:36 amVisit link – Tidy design with fast-loading pages ensures an easy and pleasant experience.
RandomNameShubs
March 21, 2026 at 10:02 amHarbor Vendor Space – Sections are clear, navigation feels natural.
BrianShubs
March 21, 2026 at 10:04 amexplore the bazaar – Took a quick browse and the design appears tidy.
Davidfab
March 21, 2026 at 10:14 amjetton promocode
ChristopherShubs
March 21, 2026 at 10:19 amopen caramel brook shop – Quick visit shows the design is easy to follow and organized.
EdwardShubs
March 21, 2026 at 11:02 amautumn marketplace – The site navigation feels clear and simple to use.
ThomasShubs
March 21, 2026 at 11:08 amExplore shop – Everything is easy to access with minimal waiting time.
RandomNameShubs
March 21, 2026 at 11:10 amCloud Vendor Portal – Organized sections, information is easy to scan.
DanielDot
March 21, 2026 at 11:45 amАвтомобільний портал https://avtogid.in.ua новини авто, огляди, тести та поради водіям. Дізнавайтесь про нові моделі, технології, ремонт і обслуговування. Все про автомобілі в одному місці для власників і автолюбителів.
Kevindem
March 21, 2026 at 11:45 amСайт міста Львів https://faine-misto.lviv.ua новини, події, афіша та довідник компаній. Актуальна інформація про життя міста, транспорт, послуги і заклади. Усе необхідне для мешканців і туристів Львова в одному зручному онлайн-порталі.
PatrickFlale
March 21, 2026 at 11:45 amСайт міста Житомир https://faine-misto.zt.ua новини, події, афіша та довідник компаній. Актуальна інформація про життя міста, транспорт, послуги і заклади. Усе необхідне для мешканців і гостей Житомира в одному зручному онлайн-порталі.
KellyIsomi
March 21, 2026 at 11:46 amБлог Києва https://infosite.kyiv.ua події, новини, цікаві місця та корисні поради для мешканців і гостей столиці. Дізнавайтесь про актуальні заходи, життя міста, розваги та сервіси. Все найцікавіше про Київ в одному зручному онлайн-блозі.
TimothyShubs
March 21, 2026 at 12:02 pmstorefront link here – Passing through the page and the formatting feels clean.
MatthewShubs
March 21, 2026 at 12:09 pmcaramelcoveemporium – Nice little discovery, design feels clean and navigation works easily.
RandomNameShubs
March 21, 2026 at 12:19 pmClover Access – Interface is clean, finding information is simple.
CharlesShubs
March 21, 2026 at 12:40 pmOpen link – No confusing menus, just a clean and accessible design.
JeffreyShubs
March 21, 2026 at 1:00 pmopen bay stone market – Stopped by briefly and the content appears nicely arranged.
RandomNameShubs
March 21, 2026 at 1:28 pmCoast Access – Interface is tidy, information is quick to find.
Larryeloma
March 21, 2026 at 1:29 pmСайт Полтави https://u-misti.poltava.ua новини, події, афіша та довідник компаній міста. Актуальна інформація про життя, транспорт, послуги і заклади. Усе необхідне для мешканців і гостей Полтави в одному зручному онлайн-порталі.
Davidgob
March 21, 2026 at 1:29 pmУ місті Одеса https://u-misti.odesa.ua актуальні новини, події, афіша та корисна інформація для мешканців і гостей. Дізнавайтесь про життя міста, транспорт, заклади і послуги. Все найважливіше про Одесу в одному зручному онлайн-порталі.
EdwardPaype
March 21, 2026 at 1:30 pmЖитомир онлайн https://u-misti.zhitomir.ua міський портал з новинами, афішею та довідником. Дізнавайтесь про події, транспорт, бізнес і послуги. Усе для комфортного життя та відпочинку в Житомирі в одному місці.
DonaldSwods
March 21, 2026 at 1:30 pmХмельницький онлайн https://u-misti.khmelnytskyi.ua міський портал з новинами, афішею та довідником. Дізнавайтесь про події, транспорт, бізнес і послуги. Усе для комфортного життя та відпочинку в Хмельницькому в одному місці.
DonaldShubs
March 21, 2026 at 1:58 pmchestnut harbor shop – Scrolling through, the page design feels smooth and readable.
JacobShubs
March 21, 2026 at 2:00 pmshopping emporium link – Browsed briefly and everything seems arranged well.
ChristopherShubs
March 21, 2026 at 2:07 pmCheck this page – Responsive browsing with neatly structured information.
RandomNameShubs
March 21, 2026 at 2:36 pmCopper Vendor Portal – Organized sections, content is easy to scan.
NicholasShubs
March 21, 2026 at 3:01 pmonline shop portal – Quick browse today and the page layout is clean.
DanielShubs
March 21, 2026 at 3:34 pmfernridgevendorhub.shop – Easy to explore and the site feels clean and well organized.
Marcoved
March 21, 2026 at 3:39 pmУ місті Вінниця https://u-misti.vinnica.ua новини, афіша заходів, довідник закладів і корисні сервіси. Дізнавайтесь про події, відкривайте нові місця і плануйте свій час у Вінниці легко та зручно.
MelvinVor
March 21, 2026 at 3:40 pmКиїв онлайн https://u-misti.kyiv.ua міський портал з новинами, афішею та довідником. Дізнавайтесь про події, транспорт, бізнес і послуги. Усе для комфортного життя та відпочинку в Києві в одному місці.
TylerWhews
March 21, 2026 at 3:40 pmУ місті Львів https://u-misti.lviv.ua актуальні новини, події, афіша та корисна інформація для мешканців і гостей. Дізнавайтесь про життя міста, транспорт, заклади і послуги. Все найважливіше про Львів в одному зручному онлайн-порталі.
Gregorytub
March 21, 2026 at 3:40 pmМіський сайт Дніпра https://u-misti.dp.ua новини, події, оголошення і довідник організацій. Зручний пошук послуг, закладів і маршрутів. Будьте в курсі життя міста та знаходьте потрібну інформацію швидко.
RandomNameShubs
March 21, 2026 at 3:46 pmCoral Network – Logical arrangement, navigating feels simple.
PaulShubs
March 21, 2026 at 3:50 pmbrowse this bazaar – Took a short look, everything is organized and accessible.
JonathanShubs
March 21, 2026 at 4:04 pmshopping market link – Just opened the site and moving around feels effortless.
GregoryLough
March 21, 2026 at 4:07 pmhttps://tower-rush-gamess.com/
Jamesjerry
March 21, 2026 at 4:29 pmНакрутка просмотров в TikTok — это быстрый способ привлечь внимание к вашему контенту и ускорить рост аккаунта. Переходите по запросу [url=https://kwork.ru/smm/47196549/zhivie-prosmotry-tiktok-video-bez-spisaniy-s-garantiey]просмотры тикток онлайн[/url] и величьте показатели популярности, повысьте доверие аудитории и попадите в рекомендации. Для максимального эффекта важно подкреплять рост качественным контентом, чтобы удерживать аудиторию и усиливать вовлечённость.
Arthursop
March 21, 2026 at 4:43 pmhttps://www.zorini.ru/ zorini
Jamesarise
March 21, 2026 at 4:54 pmsofa Откройте для себя мир mebel и sofa, где традиции качества сочетаются с новейшими тенденциями мебельной моды, и создайте дом своей мечты, где каждая комната, будь то прихожая, спальня или даже заведение общепита, будет отражать ваш неповторимый стиль.
RandomNameShubs
March 21, 2026 at 4:55 pmCotton Portal – Smooth interface, information is easy to read and understand.
MatthewShubs
March 21, 2026 at 5:03 pmCheck it out – Smooth navigation with well-arranged content and quick responses.
ScottShubs
March 21, 2026 at 5:07 pmbirch harbor homepage – Browsed quickly and the page structure feels well arranged.
CliftonIrots
March 21, 2026 at 5:09 pmmafia casino avis Bienvenue sur Mafia Casino, le domaine des jeux d’argent en ligne. Decouvrez notre avis detaille, le processus de connexion securise et des bonus exclusifs. Site officiel 2026.
Richardrop
March 21, 2026 at 5:12 pmНаучные Ленты новостей в СМИ, включая такие платформы, как Дзен и VK, предлагают свежие и актуальные материалы, позволяя читателям выбирать, что смотреть и читать, будь то новости часа или главные события века.
Robertimmib
March 21, 2026 at 5:13 pmГде можно познакомиться https://datenow.ru в России в 2026 году? Приложения для знакомств стали главным инструментом для миллионов. Но важно выбрать те, где реально можно найти человека для отношений. Не просто лайки, а искренний интерес. Разбираем, какие сервисы работают в этом году. Честно. Без рекламы. Только для тех, кто ищет всерьёз.
KennethHot
March 21, 2026 at 5:31 pmМіський сайт Черкас https://u-misti.cherkasy.ua новини, події, оголошення і довідник організацій. Зручний пошук послуг, закладів і маршрутів. Будьте в курсі життя міста та знаходьте потрібну інформацію швидко.
Rickyfrurl
March 21, 2026 at 5:31 pmСайт Чернівців https://u-misti.chernivtsi.ua новини, події, афіша та довідник компаній міста. Актуальна інформація про життя, транспорт, послуги і заклади. Усе необхідне для мешканців і гостей Чернівців в одному зручному онлайн-порталі.
BradleyWaync
March 21, 2026 at 5:38 pmаренда трактора Гарантируем оперативность и выгодные условия аренды.
Calvinprirl
March 21, 2026 at 5:46 pmСамое интересное: https://novostroi-tour.ru
AndrewShubs
March 21, 2026 at 5:53 pmvisit this marketplace – Just popping in, design looks clear and simple.
BrandonShubs
March 21, 2026 at 6:07 pmexplore the market – Scanned quickly and the content feels well arranged.
RandomNameShubs
March 21, 2026 at 6:15 pmVendor Central – Neatly arranged pages, finding information is simple.
AnthonyShubs
March 21, 2026 at 6:38 pmCheck this page – Everything is easy to find with fast and organized navigation.
RobertRit
March 21, 2026 at 7:12 pmjetton games казино
RandomNameShubs
March 21, 2026 at 7:33 pmMarketplace Hub – Pages flow naturally, moving through content is simple.
JoshuaShubs
March 21, 2026 at 8:05 pmcloud stone marketplace – Spent a few minutes here, page design appears tidy and well organized.
RandomNameShubs
March 21, 2026 at 8:50 pmCrystal Hub – Structured pages, browsing is intuitive and fast.
PaulShubs
March 21, 2026 at 9:52 pmSee more – Navigation feels natural with a simple and responsive setup.
RandomNameShubs
March 21, 2026 at 10:06 pmCollective Vendor Hub – Well-structured sections, navigation feels seamless.
BrianShubs
March 21, 2026 at 10:14 pmbrowse this outlet – Took a short look, everything seems tidy and well organized.
RandomNameShubs
March 21, 2026 at 11:21 pmDawn Marketplace – Logical design, exploring pages feels natural.
StevenShubs
March 21, 2026 at 11:25 pmOpen link – Quick load times and an uncluttered interface improve usability.
MichaelLealt
March 21, 2026 at 11:32 pmджетон казино играть
EdwardShubs
March 22, 2026 at 12:25 ammarketplace page – Just exploring today, site design feels simple and easy to navigate.
RandomNameShubs
March 22, 2026 at 12:39 amVendor Studio – Well-organized design, content is easy to read.
EdwardShubs
March 22, 2026 at 1:06 amStart browsing – Smooth interface with content easy to access without frustration.
Richardtielm
March 22, 2026 at 1:22 amУслуга накрутки просмотров на канал YouTube поможет быстро увеличить активность под вашими видео и привлечь внимание аудитории. Переходите по запросу [url=https://kwork.ru/smm/47194821/zhivie-prosmotry-yutub-video-bez-spisaniy-s-garantiey]просмотры на ютуб Кворк[/url]. Дополнительные просмотры повышают видимость роликов в рекомендациях, улучшают статистику канала и создают эффект популярности. Подходит для продвижения новых и существующих видео, увеличения охвата и ускоренного роста канала на YouTube.
RandomNameShubs
March 22, 2026 at 1:57 amDune Portal – Smooth interface, information is easy to digest.
RobertRit
March 22, 2026 at 2:10 amjetton казино онлайн
TimothyShubs
March 22, 2026 at 2:41 amonline shop portal – Browsed quickly, content is tidy and simple to follow.
BrianShubs
March 22, 2026 at 2:41 amVisit store – Smooth performance and well-organized content make browsing simple.
Ronaldkayaf
March 22, 2026 at 3:27 amБольше на нашем сайте: https://dom-u-nevskogo-novostroy.ru
Joshuabrulp
March 22, 2026 at 3:44 amПосмотреть на сайте: https://stroy-63.ru
KevinShubs
March 22, 2026 at 4:16 amGo to homepage – Smooth page transitions and clear design improve usability.
MichaelLealt
March 22, 2026 at 4:47 amjetton casino зеркало
JeffreyShubs
March 22, 2026 at 4:56 amexplore the bazaar – Took a moment to browse, layout seems simple and organized.
CharlesTaire
March 22, 2026 at 6:38 amРасширенная статья здесь: https://dom-na-izluchine-novostroy.ru
JacobShubs
March 22, 2026 at 6:51 amcoppercoveemporium – Nice little discovery, layout is tidy and easy to navigate.
dizayn kvartiry spb 445
March 22, 2026 at 7:58 amдизайн проект интерьера дизайнер квартиры спб
CharlesSlank
March 22, 2026 at 8:18 aminternational driving permit international drivers license
Mosheknips
March 22, 2026 at 8:24 amскачать игры по прямой ссылке Аналогично, скачивание из облака Mail предоставляет пользователям удобный инструмент для получения доступа к обширной игровой библиотеке, минимизируя время ожидания и обеспечивая стабильность процесса.
FrankRom
March 22, 2026 at 8:36 amkra 29 kra29. at
NicholasShubs
March 22, 2026 at 8:53 amcopperstoneemporium – Just checking this out, site feels organized and readable today.
dizayn kvartiry 504
March 22, 2026 at 9:00 amкухня дизайн интерьер в квартире дизайн квартиры
PatrickvareE
March 22, 2026 at 9:03 amна канале Кухня алгоритмов посмотрите на Кухне алгоритмов
JonathanShubs
March 22, 2026 at 11:00 amopen coral harbor shop – Quick visit shows layout is tidy and content is clear.
studiya interera 615
March 22, 2026 at 12:30 pmдизайн проект ремонт квартиры дизайн интерьера студии
LarryShubs
March 22, 2026 at 1:07 pmvisit this marketplace – Just popping in, page structure is clear and accessible.
AndrewSenny
March 22, 2026 at 3:15 pmПродвигайте свой канал в Яндекс Дзен быстрее: увеличьте число подписчиков и создайте эффект популярности. Переходите по запросу [url=https://kwork.ru/smm/45268654/zhivie-podpischiki-v-dzen-kanal-bez-spisaniy-bez-botov]активные подписчики в дзен[/url]. Накрутка поможет привлечь внимание новой аудитории, повысить доверие к каналу и ускорить рост. Подходит для новых и развивающихся блогов, чтобы быстрее выйти в рекомендации и усилить продвижение контента.
ScottShubs
March 22, 2026 at 3:21 pmthis online market – Browsing casually, content is well structured and easy to follow.
dizayn-interera 519
March 22, 2026 at 4:09 pmразработка интерьера дизайн интерьера заказать спб